The moral implications of StatCast

moralitycastIf your neighborhood baseball nerd is nerding out a little more than usual today, it’s probably because Pluto’s in retrograde right now or something, and it definitely doesn’t have anything to do with tonight’s television broadcast debut of StatCast, which will go far beyond showing balls and strikes by tracking things like player movements and batted-ball data. Ben Lindbergh has a good preview of the technology and its chief implications for expanded baseball analysis here.   Continue reading

Taking a pass on new hockey statistics

hockey pass

A quick refresher on hockey’s new statistics: puck possession correlates more strongly with winning than do things like goals or shots; measuring possession in a fluid game like hockey is difficult; as a practical solution, Corsi and its less-inclusive sibling, Fenwick, are statistics that track certain, more easily measured events (all shots, including on-goal shots and missed shots, and, in Corsi’s case, blocked shots), thereby serving as proxies for possession and, therefore, indicators of team success. Once you get past the names (as the NHL is in the process of doing), the concept is simple.

One way to improve Corsi might be to make it more comprehensive. If Corsi approximates possession by counting certain indicia of possession, it stands to reason that a similar metric could better approximate possession by counting more indicia of possession. In looking for other things to add, and keeping in mind that the practical computational benefit of Corsi is that it is comprised of easily tallied events, pass attempts– including both completed and unsuccessful passes– would seem to meet both criteria. Pass attempts indicate possession the same way shot attempts, as broadly defined under Corsi, do, and they should be nearly as easy to count.

I can think of two potential reasons why it might not make sense to expand Corsi to include pass attempts: 1) it is significantly more difficult to identify and count pass attempts than the shot attempts already being tracked, and 2) adding pass attempts to a possession proxy metric like Corsi does not significantly increase the value of the metric.

While the first might be true, it also may make it easier to collect more events. For the limited purposes of a relatively simple metric like Corsi, there should be no need to code or label the component events compiled into the single Corsi output. Adding pass attempts would save trackers from having to decide whether to include or exclude an ambiguous shot-attemptish thing. As for the second, I attempted to address this with someone who has written on the general subject, but, likely due to my own ineptitude, the exchange resembled two ships passing in the night, which is a terrible and sufficient way to conclude this post.

________________________________________________________

Related
Bouncing puck: Passing, not shooting, is the key to scoring on the ice and the hardcourt
More on passing data and the shot quality debateHockey Prospectus
There’s no such thing as advanced sports statistics

When do baseball teams score runs?

baseballline

One of the marks of a smart baseball writer is the ability to sense a trend, research its existence and nature, place her findings in context, and present her conclusions in a way that meaningfully educates readers. Inherent in this ability is the wherewithal to know when to stop researching a trend or pressing on a concept, realizing that the fruits of the work have been or soon will be exhausted. Sometimes a person who is not a “smart baseball writer” by the foregoing definition will noodle about on an idea for so long, he’ll end up with a small pile of research that no longer has any bearing on any meaningful conclusions.

Two years ago, I decided to investigate a hunch that the Detroit Tigers were having trouble scoring runs late in games. My initial research mostly seemed to support my hypothesis, and a follow-up look appeared to confirm it more strongly. More than merely interesting (and fleetingly self-satisfying), it also was informatively concerning, because it placed the team’s well-known bullpen problems in a more nuanced light: relief-pitching woes alone weren’t the problem, because the lack of late-game scoring was compounding the problem of surrendering leads during the final frames. As strange as it seemed, the Tigers had interrelated shortcomings on both sides of the plate.

One comment I received in the course of sharing those findings stuck with me: I needed to place this information in context. After all, there are plausible reasons to believe that all teams might, perhaps to varying extents, experience decreased run production in the late innings.

And so it was that, two years later, I finally discovered Retrosheet, a site that compiles inning-by-inning scoring data to a more useful degree than the resources I’d utilized back in 2013. What follows are two graphs of the inning-by-inning scoring of sixteen teams for the 2014 season. Continue reading

Baseball blogger proposes extremely traditional training tactics

cistuwarmyThe rapid seep of the internet across the biophysical landscape has allowed, in pooling pools of athletico-scriptology, the fomenting and indeed rise of a baseball-centric analytical community that fashions itself both advanced and numerological in both its substantive and aesthetic drapings, trappings, and driftings. The aforementioned pooling-facilitated rise occurred not within a vacuum chamber or bag or filter or hose but in the context and– the soon-to-be-mentioned contextualizers would announce– against the preexisting backdrop of an often-organized and, in the metaphorical and sometimes literal literal sense, gated or bound collection of Baseball Writers who, it must be noted, likely never anticipated being intransitively thrust in any respect, and much less being so thrust into a, and really, the, (readily accepted, it also must be noted) position of defending, together with the practically necessarily wholly inclusive and thus merged task of defining, both Traditional Baseball and the traditional mode of observing, considering, and understanding baseball. They awoke to find themselves Anti-Federalists, to put a probably only partially enjoyed-by-them historical frame around it. One cohort generally granted minimal time and nominal credit to the other, and vice versa, is the point.

And yet. If there is a commonality in individual operational course of dealing it is entrepreneurially this: the need to distinguish oneself. The terminology in the following sentence is positive rather than normative. From the linguistic vantage of the traditional-minded, those of the upstart class distinguished their output, and themselves thereby, progressively; inversely, retrograde. At the extremes, both vectors have their mortal/temporal/terrestrial limits, however: points at which, for example, the only way to be more progressive is to turn, perhaps suddenly, perhaps violently, retrograde– to adopt the most traditional of traditions as the vessel in which to carry forth your message still. And vice versa. (Perhaps.)

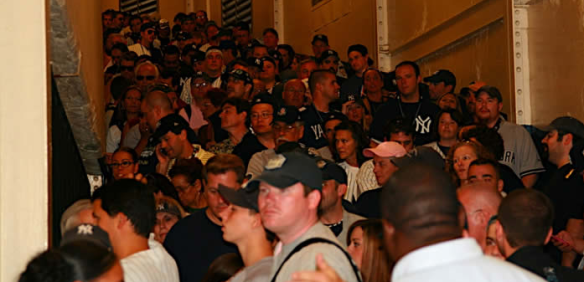
And so. We have arrived at the above-depicted depiction of the broadcasted baseball blogger. While this is not about him but about what he has done, it is maybe worth noting, or commenting or remarking upon, that he exists, or existed, among those on the unbound progressive fringe. The worth of such notation would ripen, if at all, in the lack of surprise that should accompany one who, having understood the foregoing, observes the indicia of another who has reached the terminus of his respective– if not universally respected, see supra— vector and made the only available subsequent move, here to an admittedly extreme degree.

There exist those individuals who postulate that, as the virtual world waxes, the corporeal world necessarily must wane and further wonder whether, as a consequence, the ostensibly beneficial activity features of the virtual world become diluted so as to require a severe return to the very most traditional (meaning “old”) corporeal traditions in order to affect anything meaningful, in actual terms. Here, the rarely depicted baseball blogger, in a joint venture with the United States Army,[1] brings forth a proposed plan of training and development in which those professional, as in full-time, baseball players not yet in the Major Leagues subject themselves to the complete, as in unbridled, brutality of military engagement in order to be evaluated and thereby prove their worth as those now capable of conducting Our Nation’s Pastime at its highest (unembargoed) level. War is good for this, he is saying.


[1] Sporting mascot: Black Knights.

There’s no such thing as advanced sports statistics

While “advanced statistics” are well-ensconced in the baseball world, they are still in fairly nascent stages in the faster-paced worlds of hockey and basketball. For two reasons, baseball is particularly well-suited for this so-called “advanced” analysis: 1) play essentially consists of discrete, one-on-one interactions and 2) a season is long enough to permit the accumulation of a statistically significant number of these interactions, from which meaningful trends can be derived. Hockey lacks both of these characteristics. It’s a fluid sport that rarely features isolated, one-on-one interactions, and numbers people say that the amount of compilable events during an NHL season, which is half as long as a MLB season, are too few to allow for statistical normalization. In other words, the sample size is too small.

Lee Panas’ book on advanced baseball statistics, Beyond Batting Average, which I began reading earlier this year, begins with the deceptively helpful reminder that “[w]ins and losses are indeed what matter.” Statistical data helps to understand why teams won or lost and whether and how they might win or lose in the future.

In the hockey world, advanced statistics, in general, aren’t too advanced just yet, at least when compared with the baseball sabermetric world. At present, the central concept is that, because goals– an obvious leading indicator of success (i.e., wins)– are too rare to be statistically useful, advanced hockey statistics orient themselves around possession. Because it is somewhat difficult, from a practical standpoint, to measure time of possession with useful precision, however, the leading metrics, known as Corsi and Fenwick, simply track those things a player and his team can do only when they possess the puck, which essentially amounts to shooting it.

If you prefer an expert with a more conversational style, here’s Grantland’s Sean McIndoeContinue reading

The Best Baseball Research of the Past Year

With the Super Bowl in the rear-view mirror, it’s time to get ready for baseball season, and what better way to do that than to peruse some of the best baseball articles from the past year, as identified by the Society for American Baseball Research, which has chosen fifteen (non-ALDLAND) finalists for awards in the areas of contemporary and historical baseball analysis and commentary?

My latest post at Banished to the Pen highlights each finalist and includes a link to cast your vote to help determine the winners.

As a preview, here’s my summary of my favorite article of the bunch:

Jason Turbow, “The Essence of Velocity: The Pitching Theory That Could Revolutionize Baseball, If Only The Sport Would Embrace It,” SB Nation, June 18, 2014. Turbow profiled Perry Husband, a former player who reinvented himself as a pitching coach. Really, Husband is a pitching theorist, and he labeled his theory “Effective Velocity.” The basic notion is that what matters in terms of pitch speed variation is not the actual difference between the speed of pitches but the difference in speed as perceived by the batter. This is significant, because Husband determined that actual speed and batter-perceived speed diverge for pitches thrown in certain locations. In short, pitches up and in gain effective velocity, while pitches down and away lose effective velocity. For both situations, the difference between actual and effective velocity can be between one and five miles per hour. Husband also had a revelation about the hitting process: luck is a more prevalent factor in a batter making contact than generally assumed, and hitting success depended more on pitcher mistakes. According to Husband, success in hitting, to the extent it is subject to the batter’s control, is dependent upon the batter’s ability to adjust to pitch-speed variances, and most batters cannot handle an effective velocity spread of more than five miles per hour. The very best hitters, Husband said, might be able to handle an eight mile per hour effective velocity spread. Pitchers know they need to mix speeds, but when they throw pitches to the areas where they disadvantageously gain or lose effective velocity, they neutralize the effect of their speed mixing. The one problem for Husband? He couldn’t find any Major League teams to buy into his theory. Turbow’s article tracked Husband’s search for acceptance in engaging fashion.

Read about the other fourteen nominees, see my ballot, and cast your vote here.

Tennis Time

tennis#

Most jr.-tennis coaches are basically technicians, hands-on practical straight-ahead problem-solving statistical-data wonks, with maybe added knacks for short-haul psychology and motivational speaking. The point about not crunching serious stats is that Schtitt . . . knew real tennis was really about not the blend of statistical order and expansive potential that the game’s technicians revered, but in fact the opposite — not-order, limit, the places where things broke down, fragmented into beauty. That real tennis was no more reducible to delimited factors or probability curves than chess or boxing, the two games of which it’s a hybrid. In short, Schtitt and [Incandenza] found themselves totally simpatico on tennis’s exemption from stats-tracking regression. Were he now still among the living, Dr. Incandenza would now describe tennis in the paradoxical terms of what’s now called “Extra-Linear Dynamics.” And Schtitt, whose knowledge of formal math is probably about equivalent to that of a Taiwanese kindergartner, nevertheless seemed to know what Hopman and van der Meer and Bollettieri seemed not to know: that locating beauty and art and magic and improvement and keys to excellence and victory in the prolix flux of match play is not a fractal matter of reducing chaos to pattern. Seemed perversely — of expansion, the aleatory flutter of uncontrolled, metastatic growth — each well-shot ball admitting of n possible responses, n^2 possible responses to those responses, and on into what Incandenza would articulate to anyone who shared both his backgrounds as a Cantorian continuum of infinities of possible move and response, Cantorian and beautiful because infoliating, contained, this diagnate infinity of infinities of choice and execution, mathematically uncontrolled but humanly contained, bounded by the talent and imagination of self and opponent, bent in on itself by the containing boundaries of skill and imagination that brought one player finally down, that kept both from winning, that made it, finally, a game, these boundaries of self.

David Foster Wallace, Infinite Jest 81-82 (Back Bay Books, Nov. 2006) (1996).

In tennis, the better player doesn’t always win. Sometimes, she loses in straight sets.

Imagine if basketball, football or hockey games were decided by which team outscored the other in the most periods. Get outscored by 20 points in the first quarter, and it’s no problem, you just have to eke out the last three by a point each to take the game.

That’s sort of how tennis works. Win more sets than your opponent, and you win the match — even if your opponent played better throughout. These anomalous results happen rarely, but more often on grass, the surface of play at Wimbledon, which started this week.

Wacky outcomes like [Rajeev] Ram’s pair of lottery matches happen more often at Wimbledon than at the other Grand Slams. Since 1991, 8.8 percent of completed Wimbledon men’s matches have been lottery matches, won by the player who was less successful at protecting his serve than his opponent. At the other three Grand Slam tournaments, that proportion ranged between 6.4 percent and 6.6 percent, according to data provided by Jeff Sackmann of Tennis Abstract.

The sport’s time-tested scoring system has many virtues, even if total fairness isn’t one of them. Its symmetry makes players alternate the deuce and advantage sides, switch sides of the net, rotate serving and returning. It guarantees that a player trailing by a big margin gets all the time it takes to stage a comeback, provided she performs well enough to earn that time. It keeps matches that are lopsided short, and lets close matches take all the time they need.

Carl Bialik, “An Oddity of Tennis Scoring Makes Its Annual Appearance at Wimbledon,” FiveThirtyEight.com (June 25, 2014, 7:31 a.m.).

Part of the reason baseball is so susceptible to statistical analysis is that the season is long enough for players’ and teams’ statistical averages to settle out and meaningfully describe their performance. Another reason is that the game itself is comprised of isolated interactions. No other sport is so susceptible, but the reasons appear to be different in each case. Basketball may be next up, held back only by our (diminishing, thanks to technology) inability to track and store data. Hockey statistics are thought to be less meaningful because the season isn’t long enough for the random bounces of the puck to settle out from the averages.

To my poorly informed knowledge, advanced statistical analysis has made few inroads into tennis. Part of the reason for this may be that tennis’ scoring structure, alluded to in the second passage above, does not as easily allow for the clean, direct reflection of averaged rates of good things or bad things in individual (and therefore aggregated) match outcomes. On the other hand, maybe looking to a statistical rationale for an explanation of statistics’ inability to aid in the understanding of tennis is futile. Or at least I think that’s what the first passage means.    Continue reading

Baseball Notes: Lineup Protection

baseball notesPart of the perceived strength of last year’s Detroit Tigers offense came from the arrangement of the middle of the batting order: Miguel Cabrera, Prince Fielder, and Victor Martinez; two huge bats following the biggest one in the game. The idea was that Fielder, batting fourth, “protected” Cabrera in the three hole because he was there to make pitchers pay if they wanted to simply intentionally walk Cabrera to mitigate his potent power, the same way pitchers treated Barry Bonds a decade a go. With Fielder there to “protect” Cabrera, the theory went, Cabrera’s offensive numbers should improve because pitchers would have to be more aggressive with him.

The lineup protection concept makes intuitive sense, but it has been a popular target for the sabermetric folks, who insist that “protected” hitters show no measurable improvement as a result of lineup protection. In light of Prince’s departure from Detroit, ESPN’s Jayson Stark, who surely knows much more about baseball than me, is the latest to take up the advanced statistical ax against the lineup protection effect:

Continue reading

Baseball Notes: The Crux of the Statistical Biscuit

baseball notes

The purpose of the interrupted Baseball Notes series is to highlight just-below-the-surface baseball topics for the purpose of deepening the enjoyment of the game for casual fans like you and me.

In the interest of achieving that casual purpose, this series generally will avoid advanced statistical concepts. One need not grasp the depths of wRC+ or xFIP to enjoy baseball, of course, or even to think about the give-and-take between baseball traditionalists, who eschew advanced statistics, and the sabermetricians, who live by them.

Moneyball famously highlighted this debate, such as it is, and it arose in the 2012 season around the American League MVP race between Miguel Cabrera (the eventual winner, and the traditional favorite) and Mike Trout, and again last season in the context of commentator Brian Kenny’s “Kill the Win” campaign against ascribing significant meaning to pitchers’ win-loss records.

The reason this “debate”– the “eye test,” wins, and batting average versus WAR et al.– isn’t really a debate is because the two sides have different descriptive goals. In short, the traditional group is concerned with what has happened, while the sabermetric group is concerned with what will happen. The former statically tallies the game’s basic value points, while the latter is out to better understand the past in order to predict the future. The basic stats on the back of a player’s baseball card aim to tell you what he did in prior seasons; the advanced statistics on Fangraphs, Baseball-Reference, or in Baseball Prospectus aim to tell you something about what he’ll do next year based on a deeper understanding of what he did in prior seasons.

The previous paragraph represents an oversimplification, and probably a gross one, but I think it accurately highlights the basic, if slight, misalignment of initial points of view from the two main groups of people talking about how we talk about baseball today.

Read more…

DataBall (via Grantland)

Early in the spring semester of 2013, Cervone and D’Amour proposed a new project to measure performance value in the NBA. The nature of their idea was relatively simple, but the computation required to pull it off was not. Their core premise was this:

Every “state” of a basketball possession has a value. This value is based on the probability of a made basket occurring, and is equal to the total number of expected points that will result from that possession. While the average NBA possession is worth close to one point, that exact value of expected points fluctuates moment to moment, and these fluctuations depend on what’s happening on the floor.

Furthermore, it was their belief that, using the troves of SportVU data, we could — for the first time — estimate these values for every split second of an entire NBA season. They proposed that if we could build a model that accounts for a few key factors — like the locations of the players, their individual scoring abilities, who possesses the ball, his on-ball tendencies, and his position on the court — we could start to quantify performance value in the NBA in a new way.

In other words, imagine if you paused any NBA game at any random moment. Cervone and D’Amour’s central thesis is that no matter where you pause the game, that you could scientifically estimate the “expected possession value,” or EPV, of that possession at that time.

If we can estimate the EPV of any moment of any given game, we can start to quantify performance in a more sophisticated way. We can derive the “value” of things like entry passes, dribble drives, and double-teams. We can more accurately quantify which pick-and-roll defenses work best against certain teams and players. By extracting and analyzing the game’s elementary acts, we can isolate which little pieces of basketball strategy are more or less effective, and which players are best at executing them.

But the clearest application of EPV is quantifying a player’s overall offensive value, taking into account every single action he has performed with the ball over the course of a game, a road trip, or even a season. We can use EPV to collapse thousands of actions into a single value and estimate a player’s true value by asking how many points he adds compared with a hypothetical replacement player, artificially inserted into the exact same basketball situations. This value might be called “EPV-added” or “points added.” … Read More

(via Grantland)