This column returns on a Thursday evening with two notes as lovely as forgetting your problems and drinking sangria in the park.
Scott Harris and the Young Tigers are Going Streaking:
The Detroit Tigers are off today, and, based on their recent performance, only the MLB schedule-maker can stop them from winning. On August 10, Detroit was 55-63, and, according to FanGraphs, their odds of earning a playoff berth stood at 0.5%. Since then, they’ve been the best team in baseball, going 25-10 to push their record to 80-73. They just completed a series sweep of the Kansas City Royals and, amazingly, now sit just a half game out of the American League’s last wild card spot. Those playoff odds accordingly have skyrocketed to 42.3%.

Without a game, I spent the evening listening to an interview (video below) with second-year GM Scott Harris. It’s from June 25, when the team was 36-41. It of course is exciting to hear about all of the front office’s plans and aspirations when, almost three months later, they seemingly are coming to their near-term fruition. It is pretty illuminating to hear Harris speak with confidence about those plans at a time when, at least from the outside, things were not looking too hopeful, though. I also enjoyed this interview because hosts Dan Dickerson and Jason Benetti were able to draw Harris, a self-described introvert, out into the public light in a way in which he has not previously shown himself. The public hasn’t seen or heard very much from Harris since he arrived in Detroit, and what I had observed prior to today wasn’t particularly compelling or illuminating. This, by contrast, was both insightful and enjoyable.
The MLB playoff hunt officially is on in Detroit. The team has nine games left to play, three each against the Orioles, Rays, and White Sox.
Shohei Ohtani, and only Shohei Ohtani:
Today certainly was not an off day for the Los Angeles Dodgers. Not only did the team, in routing the Miami Marlins 20-4, clinch a playoff berth for the twelfth consecutive season, but Shohei Ohtani may have had the best single day a major-league hitter ever has had on the diamond. He went six-for-six– including three home runs and two doubles– and stole two bases.
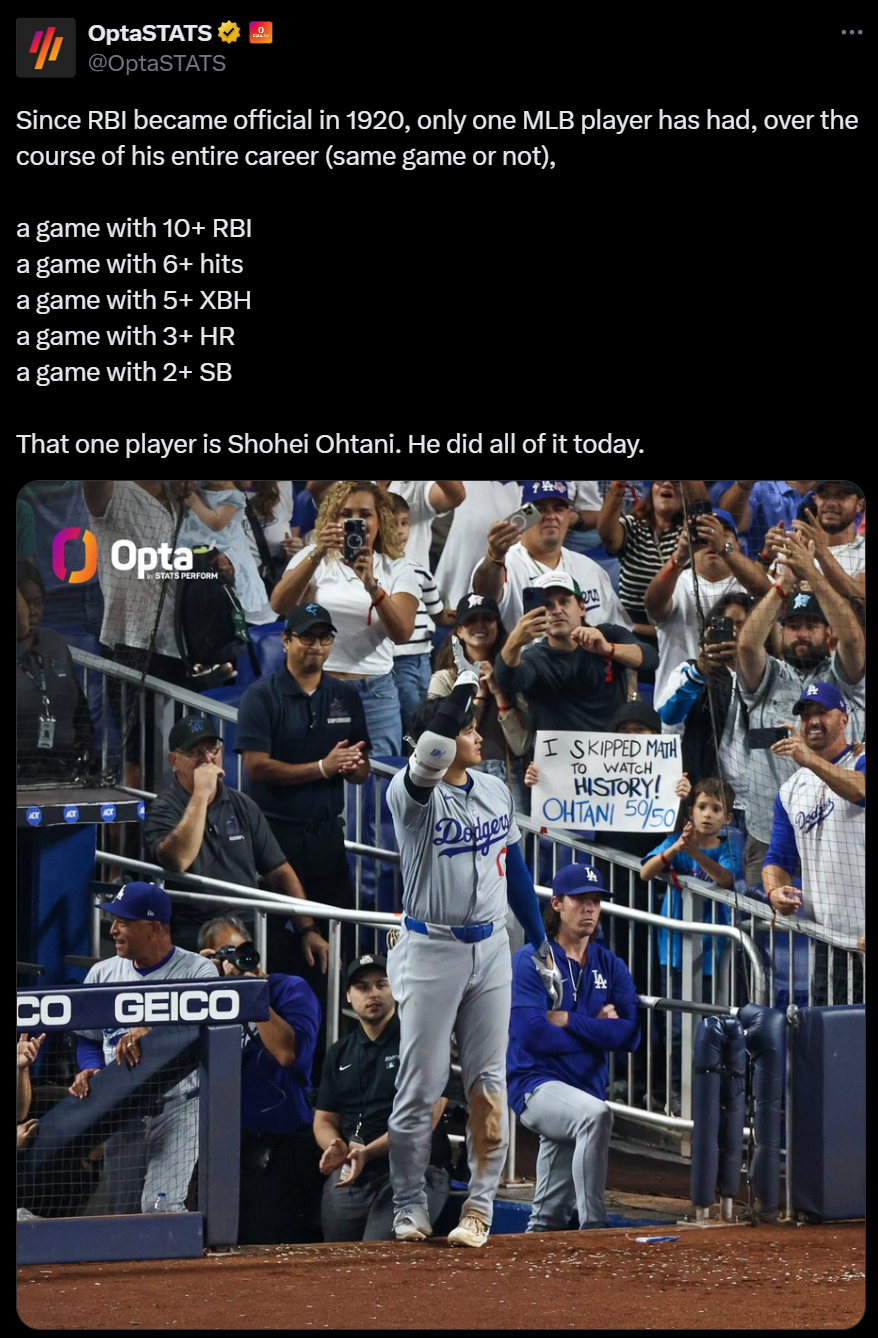
In the process, Ohtani also became the first MLB player ever to hit fifty home runs and steal fifty bases in one season and actually stands at 51/51 with nine games remaining. We knew and hoped Ohtani would be special, but this is uncharted territory.
A perfect baseball day? I’d say so.
___________________________________________________________________
Previously
Baseball Notes: New WAR Without an Act of Congress
Baseball Notes: Offensive Discrimination
Baseball Notes: Current Issues Roundup
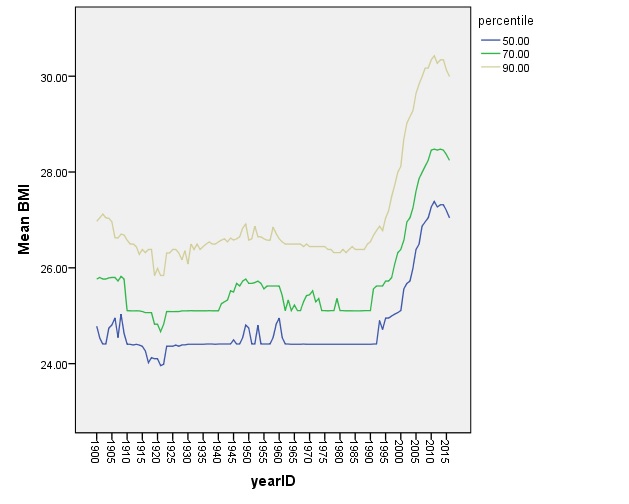
Baseball Notes: Baseball’s growth spurt, visualized
Baseball Notes: The WAR on Robbie Ray
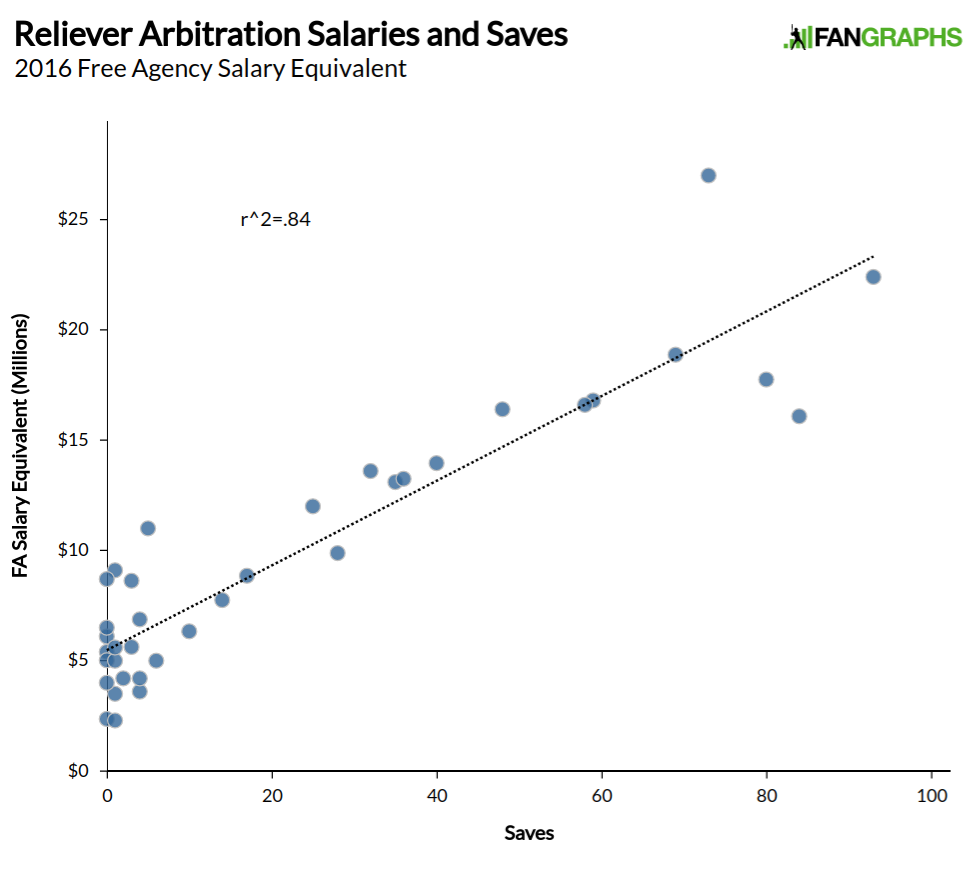
Baseball Notes: Save Tonight
Baseball Notes: Current Issues Roundup
Baseball Notes: The In-Game Half Lives of Professional Pitchers
Baseball Notes: Rule Interpretation Unintentionally Shifts Power to Outfielders?
Baseball Notes: Lineup Protection
Baseball Notes: The Crux of the Statistical Biscuit
Baseball Notes: Looking Out for Number One
Baseball Notes: Preview