The MLB season currently is on a break for All Star festivities, which makes this as good a time as many to check in on the status of my preseason predictions. Continue reading
The MLB season currently is on a break for All Star festivities, which makes this as good a time as many to check in on the status of my preseason predictions. Continue reading
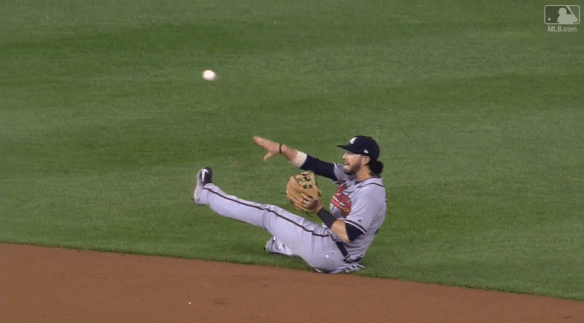
It has been exactly ten months since an occasion has arisen to file a new entry in this series on Atlanta Braves shortstop Dansby Swanson. Thankfully, last night’s win in an unusual game on the road against the Nationals provided an opportunity to revisit the former Vanderbilt star and top overall pick in the MLB draft.
With the Braves leading the Nationals 5-2 in the bottom of the eighth inning, Swanson, positioned on the first-base side of second as part of an infield shift in place against Nationals batter Matt Wieters, snagged a late one-hopper behind him that caused him to go to the ground. Swanson nevertheless was able to flip the ball to the covering third baseman, who went on to complete the inning-ending double play. Full video is available here.
Back in September, when I last wrote about Swanson here, it would’ve been difficult to believe that it wouldn’t be until nearly the All Star break before I would write about him again. Now, the All Star game comes as something of a sore subject in this context. My sure bet for 2017 NL rookie of the year, Swanson wasn’t even among the top five ASG vote-getters at his position.
If you, brave soul, have watched any Atlanta baseball games this year, though this doesn’t come as much of a surprise. In 145 plate appearances last season, Swanson was roughly average at the plate (107 wRC+; but cf. .303 TAv ). This was the source of excitement about Swanson. Everyone knew his glove would play at short, and the evidence of an average-to-slightly-above-average bat suggested great promise for his future. It’s far too soon to abandon hope in that promise, of course; after all, Swanson’s only twenty-three years old. For the time being, though, Swanson appears to have left that bat of his back in 2016. So far this season, he’s been a decidedly below-average performer at the plate (62 wRC+, .234 TAv). By the FanGraphs’ metric, no other shortstop has been worse than Swanson on offense through the same number of plate appearances. While part of that is due to a very rough start, his performance since then hasn’t exactly been a consistent upward climb.
Since Swanson’s defense continues to be solid, the question remains whether he’ll be able to find his batting legs again in the second half of this season. The good– if tentatively so– news is that he at least appears to be trying to correct course. One of the unusual things about Swanson’s approach through the first quarter of the 2017 season was a large dropoff in his swing rates. Just as suddenly as he stopped swinging, perhaps due to a lack of confidence after poor results, though, he– sometime around the end of May and the beginning of June– began swinging again, and generally doing so more than ever.

(There is a way to present this that’s even more visually dramatic, but I’m learning that some readers may prefer the telling of a story with one graph rather than three or nine.)
There’s a lot of noise in the rest of Swanson’s offensive data, and the improved results haven’t yet surfaced, but there’s evidence that Swanson– along with new Braves hitting coach Kevin Seitzer– is tinkering. Publicly, the entire coaching staff has been nothing but supportive of Swanson throughout his struggles, speaking both to his efforts at improvement and his confidence, the latter undoubtedly aided by the team’s refusal to send Swanson down to the minors.
Swanson’s going to have to do more than just swing the bat if he wants to get back to helping his team on offense as well as defense, of course. Fortunately, there is some indirect evidence that Swanson is on the right track. As Swanson began increasing his swing rates a month ago, opposing pitchers– whose behavioral changes sometimes are the best indicators of a batter’s changing level of success– started decreasing the number of pitches they threw him in the strike zone, often an indication that they view the batter as a more dangerous hitter.

On the other hand, it could be less a sign of respect for Swanson’s bat and more a simple recognition that Swanson’s swinging more at everything these days. Without the results, it’s hard to tell. Even though it isn’t likely to conclude with a rookie of the year trophy, tThe story of the second half of Swanson’s 2017 is going to be an interesting one.
_________________________________________________________________
Previously
Swansongs, Vol. 2
Swansongs, Vol. 1

Michael Fulmer is the defending American League rookie of the year, and he’s showing no real signs of a sophomore slump. That’s good because it means he’s continuing to perform at a high level. It also is good because there was some concern that his rookie success wasn’t sustainable. The basis for that concern was the gap between his ERA and his defensive-independent pitching statistics (“DIPS”). Jeff Sullivan raised the issue late last season:
It sure is tough to trust the legitimacy of Fulmer’s ERA-FIP gap. Certainly at least to this extent. I don’t think he’s demonstrated that he’s “earned” it. You might counter that Fulmer should get more credit, given the Tigers’ defense; they’re 28th in DRS, and 23rd in UZR. But it’s important to remember that defenses don’t play exactly the same every day behind every pitcher. Bad defenses can look good, and good defenses can look bad. As a comparison, think about lineups and run support. The Red Sox are the Red Sox, right? But Rick Porcello has a run-support average of 7.0 runs per nine. Eduardo Rodriguez has a run-support average of 3.0 runs per nine. Baseball’s weird. Just because the Tigers don’t have a good defense doesn’t mean they haven’t had a good defense behind Michael Fulmer.
Fulmer finished last season with an ERA of 3.06, which would have been third-best among qualified AL pitchers had he thrown enough innings to qualify (he was three short), and a FIP of 3.76. Following the general principle that DIPS (such as FIP) are more reflective of a pitcher’s true talent than ERA, Fulmer’s negative ERA-FIP gap suggested that he wouldn’t be able to sustain his low ERA going forward.
In fact, Fulmer’s successful results have continued. Through June 25, his 3.29 ERA places him in the top ten among qualified AL pitchers, and he’s been the fourth most valuable pitcher by fWAR across both leagues. Perhaps even more significantly, he’s doing all this with a positive ERA-FIP gap. Even better, he seems to be doing it without significant alteration to his approach. The only noticeable change I detected there was an increase in velocity, which will be interesting to monitor down the stretch in light of some of the concerns voiced last season about fatigue and endurance.

For context, this table (data pulled from FanGraphs) shows all qualified pitchers currently running positive ERA-FIP gaps:
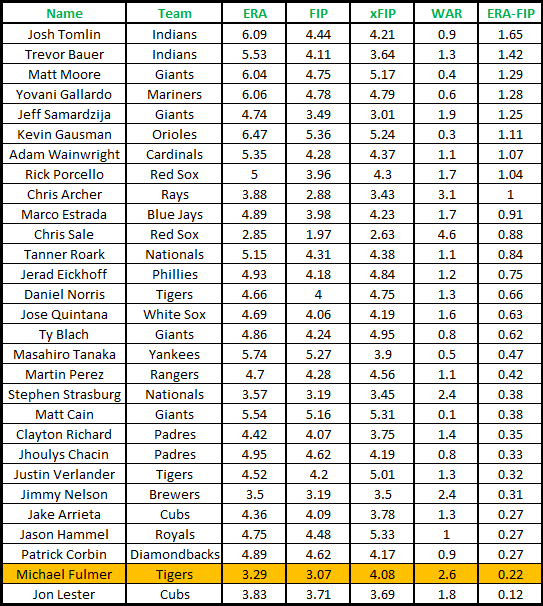
Viewed this way, Fulmer’s differential doesn’t look all that impressive– it’s only the third-best gap among his own teammates! The point, though, is the trend. Last year, he had one of the worst ERA-FIP gaps, which is what prompted Sullivan’s concern about Fulmer’s potential for future success, and there he is, near the bottom of the list of qualified pitchers from the 2016 season: Continue reading

The great Miguel Cabrera is thirty-four years old. His team, once a surefire contender, is stuck in neutral, and Cabrera, their ostensible offensive engine, has only been slightly above average at the plate (108 wRC+, which would be the worst of any of his seasons since his rookie year (106 wRC+)).
It looks like we are seeing the beginning of Cabrera’s inevitable decline, which has observers taking stock of Cabrera’s likely legacy and projecting his place among the greats once he puts that magic bat down for good. For example, Yooper David Laurila included this observation in a recent edition of his Sunday Notes column:
Lou Gehrig had 8,001 at bats, 534 doubles and 493 home runs. Miguel Cabrera has 8,028 at bats, 533 doubles, and 451 home runs.
The day before, conversation on Fredi the Pizzaman’s Pizza Cave Podcast turned to Cabrera as the panel debated whether he would join Albert Pujols in the 600-home run club. (Pujols, whose major-league debut came two years before Cabrera’s, passed that milestone on June 4 of this year.) That discussion prompted a broader one about both players’ achievements and legacies.
Here’s a quick graph to introduce and orient this comparative analysis:

By aligning the two players’ offensive performances (measured by wOBA) to their individual age-seasons, we can develop a rough snapshot of their careers at the plate. This graph illustrates a couple of significant trends. First, it’s easy to identify the clear tipping point in Pujols’ career, which very clearly has two distinct halves. Second, Pujols came out of the gate hotter than Cabrera, who needed a couple years to ramp things up. Both achieved production levels that make them generational talents, but when it comes to counting statistics (like career home run totals), the gap in those early years may be what will end up separating these two in the final analysis. All players eventually decline, but that just means it’s going to be tougher for Cabrera to make up for his comparatively slow start now.

Again, this graph compares Pujols and Cabrera by aligning their career seasons. Even though they’ve accumulated homers at a similar rate, merely keeping pace in that regard likely won’t be enough for Cabrera in light of Pujols’ head start unless Cabrera has more years left in his tank than Pujols has in his. And right now, that first part– keeping pace– isn’t looking so sure for Cabrera. Here’s the same graph as the one above expanded to include 2017 numbers:
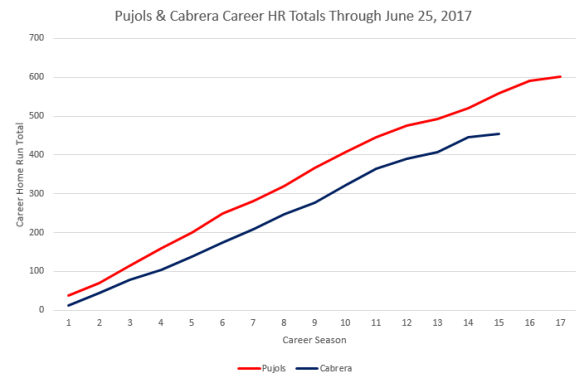
This comparison to Pujols thus suggests that Cabrera is unlikely to reach the 600-homer benchmark for two reasons: 1) a slow start and 2) what looks to be an early– relative to Pujols– decline. None of this is to say that Cabrera can’t or won’t reach 600 home runs. Comparing him to the most recent guy to do it suggests that, absent some change, he’s unlikely to get there.
That change could come in the form of a late-career rejuvenation. Cabrera’s capable of ripping off amazing offensive tears, and he certainly could do that again. It always has felt a bit odd to think of Cabrera as unlucky, but there continues to be evidence that Cabrera’s offensive numbers should be even better than they already are based on the quality of contact he makes. A third change could be a positional one. Just as David Ortiz extended his career by becoming a full-time designated hitter, the thought is that Cabrera could alleviate some of the strain on his body by being relieved of his defensive obligations.
All of this is relative, of course. Failure to accumulate 600 home runs is no indictment on a player or his legacy. Only nine players ever accomplished that feat, and three of them are Barry Bonds, Alex Rodriguez, and Sammy Sosa. Three more of them are Hank Aaron, Babe Ruth, and Willie Mays.
While we’re here, two concluding notes on the overall comparison between Pujols and Cabrera. The first, which came up on the podcast episode linked above, involves postseason success. As a rookie, Cabrera was a member of the Florida Marlins team that won the World Series in 2003. Pujols was a member of the 2006 Cardinals team that swept Cabrera’s Tigers in the World Series, as well as the 2011 World Series team that beat the Rangers in seven games. Pujols also has been a better hitter in the playoffs, though both have been significantly above average (164 wRC+ vs. 136 wRC+). Postseason appearances are significantly team and context-dependent and involve small samples (seventy-seven games for Pujols and fifty-five for Cabrera), but it’s something to mention.
The second is a total career assessment. Neither player is retired, obviously, but that doesn’t mean we can’t take a peek at what their legacies look like right now. One way to do that is with JAWS, an analytical tool designed to assess Hall-of-Fame candidacy. Its creator, Jay Jaffe, explains:
JAWS is a tool for measuring a candidate’s Hall of Fame worthiness by comparing him to the players at his position who are already enshrined. It uses the baseball-reference.com version of Wins Above Replacement to estimate a player’s total hitting, pitching and defensive value to account for the wide variations in scoring levels that have occurred throughout the game’s history and from ballpark to ballpark. A player’s JAWS is the average of his career WAR total and that of his peak, which I define as his best seven years. All three are useful for comparative purposes, as Hall of Famers come in different shapes and sizes. Some—Hank Greenberg, Ralph Kiner, Sandy Koufax, Jackie Robinson—dominated over periods of time cut short by injuries, military service or the color line. Others such as Eddie Murray, Don Sutton and Dave Winfield showed remarkable staying power en route to major milestones. While it’s convenient to believe that every Hall of Famer must do both to be worthy of a bronze plaque in Cooperstown, they can’t all be Babe Ruth, Ted Williams or Willie Mays, or the institution would merely become a tomb, sealed off because so few have come along to measure up in their wake.
For the purposes of comparison, players are classified at the position where they accrued the most value, which may be different from where they played the most games, particularly as players tend to shift to positions of less defensive responsibility—and thus less overall value—as they age. Think Ernie Banks at shortstop (54.8 WAR in 1,125 games there from 1953 to ’61) as opposed to first base (12.8 WAR in 1,259 games there from ’62 to ’71). A small handful of enshrined players, including pioneers and Negro Leaguers with less than 10 years of major league service, are excluded from the calculations; Satchel Paige and Monte Irvin, for example, had major league careers too short to use as yardsticks for non-Negro League players.
By JAWS, Pujols and Cabrera both are clear Hall of Famers even if neither ever played another game, but there’s a clear separation between the two. JAWS has Pujols as the second-best first baseman ever, trailing only the aforementioned Gehrig, while Cabrera currently slots at the eleventh position, right next to Jim Thome (another one of those 600-HR guys). Pujols has two more years under his ample belt than does Cabrera, and neither is done playing. (This probably is a decent place to note contract details: Pujols has four more years on his current contract, while Cabrera has at least six.) As with the home-run chase, so too with overall career value: Cabrera has a good bit of work to do if he’s to catch Pujols.
The book is not closed on either of these two great baseball stories. Pujols and Cabrera have yet to author their final chapters. The balance of their works likely are complete, however, and from that we can make educated predictions. Both have their high points and distinct achievements, but it looks like Pujols’ early peak will prove a little too high and too long for Cabrera to close the gap. Here’s hoping I’m wrong.
Not as in “relief from the burden of Short Relief.” More like, “Short Relief (at last) has provided me with some relief.” I am not a longtime reader of Baseball Prospectus the way people who truly have been reading Baseball Prospectus for a really long time casually sprinkle into digitally transmitted discourse that they are longtime readers of Baseball Prospectus, but I have been reading the site and its books and listening to its podcasts (or one of its former ones, anyway) for a few years and been a subscriber for the balance of that time, and there is no question that the temperament of the site has changed over that period. Since I have been reading it, BP has had three editors in chief: Ben Lindbergh, Sam Miller, and Aaron Gleeman, its current EIC. Miller, who now writes for ESPN, has a special ability to blend the analytical and the fanciful (perhaps “imaginative” is a better word here, though neither are correct), and, by outward appearances, was a judicious editor. Baseball writers everywhere usually write about baseball in serious tones, and Miller was a breath of fresh air in that regard, if a measured one. It’s good to have outlets for some less serious baseball writing too. There used to be a whole place for that, which was called NotGraphs, but it was terminated in late 2014. Thereafter, its postmortal spirit attempted to eke out a living in an even smaller corner of the web, but that campaign fizzled.

Although Miller never misses an opportunity to credit Lindbergh, his former boss and collaborator on two significant projects who now writes for The Ringer, as the best in the business, it’s clear to me that it’s Miller who’s left a large impression on the current version of BP. Whimsy, once reserved for sidebar Hitlist one-liners and a few player comments in the BP Annual (not unusually in the form of a Simpsons reference) everyone raced to find, photograph, and post on social media web platform Twitter.com, now abounds– or, at least, attempts to abound– at BP. This is most visible in the daily Short Relief feature, a sort of refugee camp for NotGraphs alums that typically contains three essays, or maybe poems, or maybe just a picture, that effort and imitate toward the odd and purposefully absurd.
I never read every article every day at BP, but I’ve never read less of BP than I do now (Russell Carleton and Rob Mains are musts), and I very rarely read Short Relief. I’m glad a major baseball site is trying to resurrect NotGraphs, but this take just doesn’t hit me right. It feels very unessential and often forced. A lot of that probably is due to the fact that it’s an everyday feature. It’s really hard to produce original funny, silly, odd, unusual, quirky, or whatever content on a daily deadline. It’s even harder when you’re limited to one subject area. (There’s also the part about the site’s budget crunch and probably a little friction with the idea that BP is contributing resources to Short Relief rather than its core mission, which seems noticeably understaffed at the moment.)

BUT. Today’s Short Relief I did read, and today’s Short Relief I did like. It contains two entries, both by former owners of NG bylines. The first, from David G. Temple, once the managing editor of TechGraphs, is a short story about baseball cards that really hit home for me, as anyone reading ALDLAND’s late-night tweets earlier this week might have guessed. The second, from Short Relief coordinator Patrick Dubuque, provides a short metacommentary on the Short Relief series itself that resonated in light of the above-transcribed feelings about the Short Relief series. I commend both to your screen and eyes.

When it comes to the 2017 Detroit Tigers, we are in full-on damage-control mode here at ALDLAND, looking high and low for fixes for everything from the bullpen to the infield defense. On an individual basis, though, no player seems to be the recipient of more scorn from those who express Tigers-related opinions on the internet than Justin Upton. The critical refrain, when it comes to the younger Upton brother, is simple: he strikes out too much.
I spent many of the pages of last season’s Tigers diary on Upton. Having watched him during his days as a member of the Atlanta Braves, I knew he was a good and exciting player, but also a streaky player, and I hoped that Detroit fans would be patient enough to see through the streakiness and hold out for the production, they generally weren’t. Some career-low offensive numbers in the middle of the season didn’t help his case, and people (this website’s readers excepted, obviously) mostly missed that, in the final analysis, his full-season production was almost exactly as anticipated: an above-average offensive profile with thirty-one home runs, matching a career high. Also likely to be forgotten is his hot September– thirteen home runs, .292/.382/.750, and 196 wRC+, basically Babe Ruth’s career line– that was the main reason the team was in contention entering the final series of the regular season.
The Tigers didn’t make the playoffs last year, though, and things are looking pretty bad right now, too, which makes it easy to continue to beat the Upton-strikeout drum. And look, he’s currently running a career-high 31.2% strikeout rate (ten percent above league average), which isn’t helping matters.
When it comes to Upton, though, it isn’t as easy as simply focusing on strikeouts. For example, he’s running a walk rate that’s substantially higher than last season’s, meaning that his BB/K ratio is in line with his career ratio. In general, though, this is what he does. Like many power hitters in today’s game, he hits a lot of home runs and he strikes out a lot. Strikeouts are frustrating, but harping on them, in Upton’s case, isn’t productive. As Dave Cameron discussed at FanGraphs today, Giancarlo Stanton has undertaken the sort of change Upton’s critics are demanding, dramatically cutting his K% and upping his contact rate. The result? A very similar, if slightly worse, overall offensive profile. Cameron explains:
To this point, the change hasn’t served to make Stanton better, just different. His 135 wRC+ this year is pretty close to his career 141 mark, as the reduction in strikeouts have also come with a small drop in BABIP and a continuing decline in his walk rate. And the latter is of particular interest, because it shows how differently he’s being pitched these days.
In his 2013/2014 heyday, only 41% of the pitches thrown to Stanton were in the strike zone, about as low a mark as pitchers will go for a hitter who doesn’t instinctively swing at anything out of their hand. This year, pitchers are throwing Stanton strikes 44% of the time, about the same rate they’re challenging Trevor Plouffe and Albert Pujols. Pitchers are coming after Stanton now, perhaps recognizing that maybe he’s not taking the herculean swings that he used to take, and the penalty for throwing him something in the zone isn’t quite what it used to be.
As his contact rate has climbed, Stanton’s doing less damage on contact than he used to be [sic], and perhaps not surprisingly, is now seeing more strikes thrown his way. These are all shifts more than total revolutions, as he’s still a power hitter who does a lot of damage when he hits the ball, but he’s now moved more towards the normal levels of contact and production, rather than being an outlier on both ends.
(emphasis added).
Could Upton stop striking out as much as he does now if he wanted to? Probably. Changes in approach have complex consequences, though, and the result of those consequences might not work a net positive on Upton’s production even if he pushed himself to a career low strikeout rate and career high contact rate like Stanton has. (It essentially is the Ichiro Suzuki home run question asked from the opposite side of the player comp spectrum.)
The broader point, I think, is one that came to me during my look at switch hitters’ approaches to defensive shifts last year: we should engage in player analysis with the initial assumptions that (1) the player is a skilled athlete capable of undertaking multiple approaches to his or her sport, and (2) the player intelligently approaches his sport by selecting the optimal approach, given his or her strengths and weaknesses, designed for performance at the highest possible level. This is a conservative outlook that essentially assumes that the player’s status quo modus operandi represents the player’s optimal modus operandi. Like the Tigers fans who assume they can fix Upton by telling him to strike out less, it’s easy to assume we know better. As more complex investigations often reveal, however, the player had it right all along.
______________________________________________
Previously
Saving Detroit: Soft in the Middle Now – 5/30
Saving Detroit: Reliever Relief, Part 2 – 5/11
Saving Detroit: Reliever Relief – 5/8
Related
2017 Detroit Tigers Season Preview
Is the next Mike Trout already in Detroit?
A strategic switch to beat the shift?
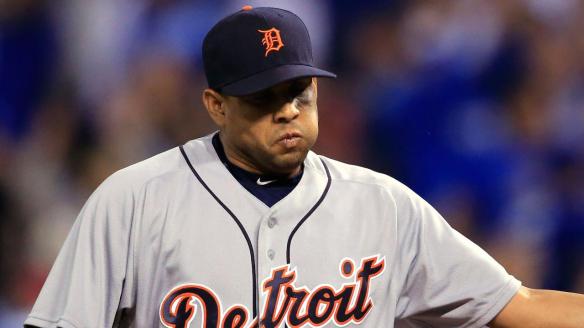
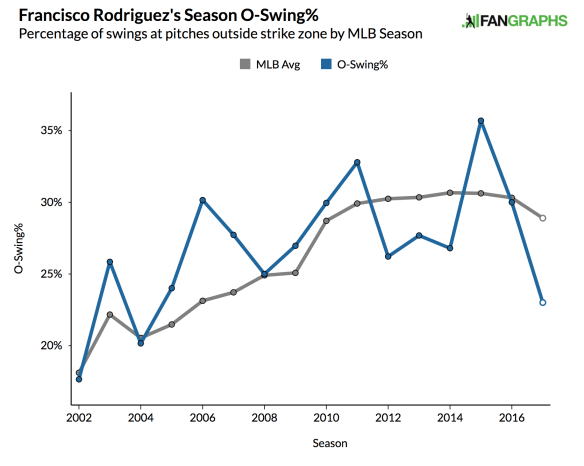
Despite being pretty good at almost every aspect of building a winning baseball team, the Detroit Tigers have, for years, had as difficult a time finding a reliable closer as the Cleveland Browns have finding a quarterback. Even reading the names Jose Valverde and Joe Nathan is enough to make most fans shudder, and, unfortunately, it’s come time to add Francisco Rodriguez to that list.
There were reasons to be hopeful when Rodriguez came over to Detroit before last season. Even though, at thirty-four years old, he wasn’t the fire-breathing, overpowering force he was in his younger days, it looked like he’d traded some heat for wisdom and found a way to continue to succeed as he aged. The active saves leader did pretty well last year, and, even if there were some missteps in key moments, it was hard to be too disappointed with the overall body of work. He even seemed to help teach manager Brad Ausmus a helpful lesson about bullpen management, as Ausmus slowly broke out of the conventional mold and began using Rodriguez in high-leverage four-out situations rather than rigidly reserving him for the ninth inning alone.
Baseball famously is a game without a clock (at least for now), but humans lack such an exemption, and the clock appears to have run out on Rodriguez in his age-thirty-five season. After single-handedly blowing two games over the weekend, it sure seems like Rodriguez has turned into a dip-filled pumpkin. By one measure, Win Probability Added, he’s done more to help his team lose than any other reliever than all but one other reliever in baseball.
It’s tough to pinpoint exactly what’s wrong with K-Rod this year. His velocities are down a little bit, but they’ve been going down pretty much steadily over the course of his career. That’s nothing new, and it’s why he started prioritizing offspeed pitches over his cooling fastball as he got older. Other indicators, including location, pitch usage, and release points, all look as reasonably expected. The results don’t lie, though; batters are absolutely hammering him this year:
 It looks like he’s throwing to the same places– low, and in/away– he usually has, but with much less success. It’s hard (for me, at least) to pinpoint with these various advanced tools exactly what’s happened, but it’s clear that Rodriguez no longer is fooling batters, a veritable death knell for deception-reliant pitchers like him. The way batters consistently chased– and, more often than not, missed– his diving, low and away pitches is something I marveled at last year, my first really watching him and his seemingly simple approach. For whatever reason, though, they aren’t even remotely fooled this year, as the below graph of Rodriguez’s out-of-zone swing rate from a FanGraphs article posted this evening shows:
The Tigers’ margin for error this season is extremely narrow, and Rodriguez just cost them two wins on an important West-Coast roadtrip. They don’t have time to let Rodriguez find himself in game-ending, high-leverage situations. Ausmus needs to rearrange his bullpen immediately. It already was a thin crew, but the status quo won’t do. It’s time to promote the Wilsons and find out if the rest of this motley bunch can handle a heavier load.
The Tigers outscored the Mariners 20-19 this week but lost two of three, and all you get is this crummy article on Seattle’s new shortstop. My latest post at Banished to the Pen takes a quick look at the ways in which Jean Segura is building on his 2016 breakout.
The full post is available here.
FanGraphs released its staff (extremely broadly defined, as you’ll realize very soon) predictions for the 2017 MLB season, to which I contributed, today. This includes aggregated predictions for each division and wild card position, as well as MVP, Cy Young, and ROY winners. In a decision not my own, the post also breaks out each individual’s predictions arranged alphabetically by first name, making my guesses dangerously easy to spot (though very slightly less dangerously easy to spot than last year).
If you want to see what the baseball future could but likely will not be, click here, and then come back here and add your own predictions in a comment below.
I used to write the sports technology roundup at TechGraphs, an internet website that died, and now I am writing the sports law roundup at ALDLAND, an internet website.
After a week off to attend a fancy law conference, we’re back with the top sports-related legal stories from the past week or so:
Sports court is in recess.