Toward an MLB MVP-Voting Rubric

[The following is an introduction to a more thorough study I intend to publish at Banished to the Pen following the conclusion of the current MLB season the purpose of which is to suggest an approach to harmonizing traditional ways of thinking about the sport’s annual MVP award with available sabermetric principles. -ed.]

Last week’s Zach Britton trade reminded me about the idea of championship win probability added (cWPA). In 2016, Ben Lindbergh made the case that Britton, then serving as the closer for the Baltimore Orioles, should win the award for the most valuable player in the American League based on the idea that Britton, at least during the regular season, had done more to help his team win the World Series than any other player had helped his own team win the championship. Britton– again, a relief pitcher who threw sixty-seven innings– finished eleventh in MVP voting. Mike Trout, the WAR leader, claimed the award, his second, and I don’t suspect many people have thought much about cWPA since then.

What should make cWPA (defined: cWPA “takes individual game win probability added (WPA) and increases the scope from winning a game to winning the World Series. Where a player’s WPA is the number of percentage points that player increased or decreased their team’s probability of winning a single game, their cWPA is the number of percentage points the player increased or decreased their team’s chances of winning the World Series.”) attractive to a broad swath of the MVP electorate is that it accounts for the traditional notion that the individual award-winner ought to have been on a winning team. When handing out performance awards for a given season, it makes sense to reward players based on what they actually accomplished, as opposed to what they should have accomplished but for bad luck, sequencing, weak teammates, strong opponents, environmental variations, and other contextual and extrinsic factors. After all, these factors work, to some extent, on all players, and just as we determine team season standings based on actual win percentage (and not a sabermetrically adjusted winning percentage), so too should we determine individual season awards based on actual results.

This is not to say that the MVP should go to the player with the best batting average or the Cy Young to the hurler with the most pitcher wins, obviously. While using cWPA as a guide will steer us toward players who are, in the conventional sense, winners, it uses accepted sabermetric principles to maneuver in that direction. Still, I think there may be some concern that cWPA, when used alone as a player-valuation measure, might be too context-dependent and inclined to reward disproportionately an otherwise unremarkable player who happened to find himself in one or two of the right places at one or two of the right times. Certainly, though, it seems likely that a player who accumulated performances in those situations often enough to find himself near the top of the cWPA leaderboard also would be a well-rounded and highly productive player in all situations.

Still, I was curious how well cWPA correlated with WAR, something it ought to do reasonably well if it’s to be available as a useful informant for MVP voters. I pulled the cWPA numbers for the current season and used FanGraphs’ version of WAR mainly because their combined WAR leaderboard made data manipulation easier.

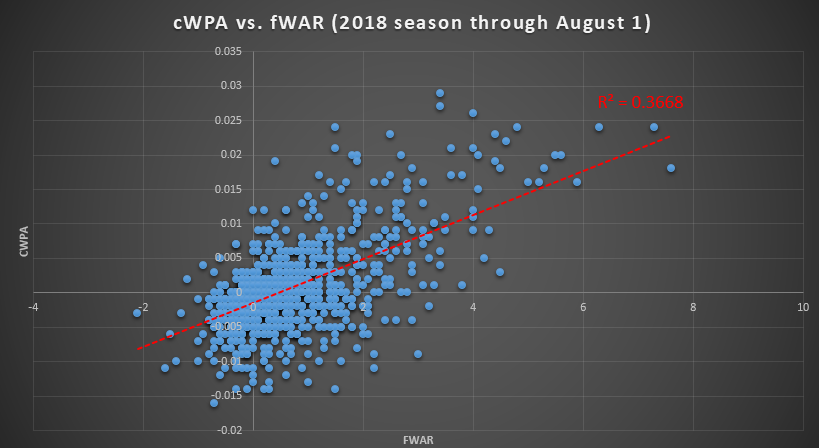
(click image to enlarge)

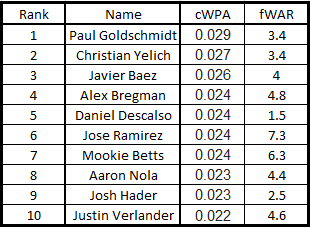
I don’t have a statistics background, so I won’t comment on the significance of the correlation between cWPA and fWAR except to say that it seems sufficiently strong. If you’re curious about who’s who on this plot, here are the current top-ten players by cWPA:

There is a lot of significant, championship-relevant baseball yet to be played in 2018, and a more significant study of the above would have involved prior, completed seasons, but I think there’s something here and wanted to share what I had compiled on the current season as it moves into August and teams begin their playoff charges in earnest. I anticipate updating this information after the conclusion of the regular season and supplementing it with historical data to create an even more robust analysis. In the meantime, I welcome any input on win probability added and seasonal awards.

Quick observations on the occasion of the latest Cole Hamels trade

When the Phillies traded Cole Hamels to the Rangers in 2015, it felt like a big deal. Texas was in the playoff hunt, and Hamels went 7-1 in twelve starts for them down the stretch. The return for Hamels (plus Jake Diekman) was voluminous in that it was comprised of six players. If you squint or are a dedicated Phillies or Rangers fan you might recognize a couple of those names.

Last night, the Rangers, decidedly not a contender just three years later, chose to ship Hamels up to the Cubs. The teams have not officially confirmed the deal, but reports indicate that the return includes minor-league pitcher Rollie Lacy, a second pitcher who is “not a prospect,” [UPDATE: Eddie Butler, a pitcher who’s split time between the majors and Triple-A for the past four or so seasons; cash considerations also provided] and a player to be named (even) later.

What are the Cubs getting in the oft-heralded Hamels? In short, a starting pitcher in decline. Hamels had an excellent run with Philadelphia, but he’s been something a little less than excellent since. His 2017 (4.20 ERA, 4.59 FIP, 5.47 DRA) was his worst MLB season to that point (0.2 WARP), and he’s been even worse in 2018 (4.72 ERA, 5.22 FIP, 6.26 DRA, -0.2 WARP).

As news of the Hamels trade was breaking last night, some people contended that things would be better for Hamels in Chicago because Wrigley Field’s friendly confines are friendlier to pitchers than the Rangers’ home in Globe Life Park. There’s not nothing to that idea: offense played up in Arlington more than anywhere else in 2018. Wrigley hasn’t exactly been a run suppressor, though, as it too favors hitters. Hamels may see some comparative venue-based benefit as he moves north, but it likely will be negligible over a couple months.  (One possible estimation of the magnitude of the difference is the difference between his FIP (5.20 on FanGraphs) and xFIP (4.18) in light of the slightly wider spread between Globe Life and Wrigley looking just at home runs, though Wrigley still is playing hitter-friendly in that regard.) And, of course, metrics like DRA and WARP (which, for pitchers, is based on DRA) already account for park factors.

Another thing I noticed last night as news of this transaction began to leak out was that Hamels is allowing a 23.2% line-drive rate, almost 4.5% over last season and a career high. That isn’t something that is park-specific, nor is it something for which Hamels really can share responsibility with his teammates. Hitters are squaring him up this year.

Continue reading

A narrowly focused update on Zach Britton, new New York Yankee

blern

Last night, the New York Yankees completed what to this point constitutes the second-most significant trade of the month when they sent three prospects to Baltimore in exchange for a few months of closer Zach Britton’s services.

The Orioles drafted Britton out of high school in 2006, and Britton debuted five years later as a full-time starter for Baltimore in 2011. By 2014, he had transitioned to a full-time bullpen role, and my earliest memories of him date to two years after that.

Britton was a key part of the 2016 Baltimore team that finished second in the AL East and made the postseason as a wild card. That was the Orioles’ last playoff appearance, and manager Buck Showalter’s decision not to use Britton as the win-or-go-home contest went into extra innings granted the game an air of infamy.

Prior to that, writer Ben Lindbergh memorably made the case that Britton, a closer who would pitch sixty-seven innings that season, merited serious consideration for the AL MVP award. As recorded contemporaneously in these digital pages, Lindbergh’s argument was based on a modification to the notion of Win Probability Added (WPA):

Earlier today, Ben Lindbergh argued that Baltimore reliever Zach Britton has a claim to the 2016 AL MVP award. To make that case, Lindbergh demonstrated that Britton had done more than any other player to help his team win games that mattered. Lindbergh did this by placing Britton’s performance in the context of the individual games in which Britton pitched– did Britton’s actions help or hurt his team’s chances of winning that game, and to what degree did they do so?– and then placing those games in the context of his team’s position in the playoff hunt. Viewed this way, Britton (excellent contributions to a good team in close contention) is more valuable than, for example, Mike Trout (superlative contributions to a bad team far out of contention). The metric that captures this contextual performance concept is called Championship Probability Added (cWPA), and Britton currently holds a commanding lead atop that leaderboard.

(Emphasis added.)

The road has been a bit rough for Britton since that 2016 season, however, as the trade article linked above summarized:

After consecutive two-win seasons in 2015 and 2016, he has missed time with the following injuries:

  • April 16, 2017 – Hits the disabled list with a strained left forearm and misses a little over two weeks.
  • May 6, 2017 – Almost immediately after return from disabled list, goes back on it with same injury.
  • August 25, 2017 – Injures his left knee and is shut down in September.
  • December 2017 – Hurts his right Achilles in an offseason workout requiring surgery.

The lefty returned to action on June 12 but hasn’t been lights out like he was before 2017, with a 4.43 FIP and 3.45 ERA thus far. He’s been a bit better of late, tossing eight straight scoreless outings, but has still produced just six strikeouts against four walks in that span. Perhaps more encouragingly, his velocity is up over his last few outings, getting closer to the 97 mph sinker he used to throw. If the velocity return is here to stay, better results might follow.

By a clear margin, Britton led all pitchers in WPA in 2016. This year, however, he’s nowhere to be found atop that list. That no team has done as little winning as Baltimore (record: 29-73) likely contributed to that shift. Still, the fact that he has a negative WPA (-0.13) for the first time since he moved into the bullpen seems worth noting in light of the foregoing.

As the block quotation immediately preceding the immediately preceding paragraph indicates, there are a number of red flags that suggest that the version of Britton the Yankees acquired (insert reference about Redcoat POWs) last night may be meaningfully different from the one who presented an intriguingly compelling case for consideration as the most valuable player in the American League in 2016.

As a closing addendum, the current leaders in pitcher cWPA for 2018 are Justin Verlander (.023) and Josh Hader (.020).

________________________________________

Related
Baltimore Closer Zach Britton Isn’t Just a Surprise Cy Young Contender — He’s the AL MVP

Designated Sitter, or, Manfred Ado About Nothing

manfred dp

For people who write about baseball, the All-Star break offers at least two things: (1) an intraseasonal oasis in which one can examine and address baseball topics over the span of a day or two without worrying that the otherwise constant barrage of new baseball events occurring that might, for example, mess up the performance numbers on which a writer had founded his or her baseball writing and (2) a probably countervailing force in the form of significant public interviews with the sport’s leaders addressing the sport’s Big Topics Of The Day.

Regarding the latter, Commissioner Rob Manfred kicked things off this morning with an appearance on Dan Patrick’s radio show. Here are my notes of the highlights:

manfred dp notes

People love to talk about the designated hitter and whether the National League will adopt it, and Manfred’s mention of the subject this morning predictably reignited the “conversation”:

I suspect that those on the fence or without a considered opinion on the subject may have found prodding from recent articles like this one Ben Lindbergh published last month illustrating the historically poor offensive numbers from current pitchers. What many of these conversants don’t do is think about this conversation from the DH side, however. There really is no doubt that a designated hitter is going to bat better than a pitcher, but the nature of the DH position is changing, both in terms of the players who are filling that role and their performance levels.

Regarding the union’s particular partiality to the DH, are David Ortiz-types really the players finding extra PAs as designated hitters? Take a look. Continue reading

The MLB Hot 100: At the 2018 All-Star Break

There are plenty of ways to win in baseball, and plenty of ways to assemble winning baseball teams. To state the extremely obvious, a team needs productive players in order to win. FanGraphs took a detailed look at the assembly and production of this year’s teams in terms of their players’ wins above replacement, with a particular focus on the Houston Astros’ ability to avoid playing negative-WAR players:

What follows here is a significantly less-detailed look at 2018 team composition and production as of today, the first day of the All-Star break and the artificial halfway point of the season. Teams have not all played the exact same number of games to this point, but the game totals are sufficiently close for a coarse-grained “analysis” like the one I’ve conducted today, which isn’t analysis so much as making a graph for you to view while there isn’t real baseball for you to view.

The idea is that teams that are poorly represented among baseball’s top-100 players, defined here as the top 100 players on the FanGraphs combined WAR leaderboard, probably are poorly represented as among the top performing teams. Too many words already spent on a simple point. To the graph:

2018 mlb top 100 and team wins

The rosters of the Blue Jays, Padres, and White Sox include none of the top-100 players of the 2018 season, and those teams have bad records. The Astros have the most top-100 players, and they have a good record. The Mets have four of the top-100 players– Jacob deGrom, Brandon Nimmo, Asdrubal Cabrera, and Noah Syndergaard– but a bad record– just thirty-nine wins– reflective of the fact that what remains is not merely mediocre but bad (check that negative-WAR graph above). Oakland maybe isn’t going to keep winning at a .567 rate in the second half.

I don’t know if this graph tells you anything you don’t know. I don’t know if it tells you much at all beyond the data it contains, which is quite simple. But, if it speaks to you, let me know.

The Home Run Derby is tonight at 8:00 on ESPN. The All-Star Game is tomorrow night at 7:30 on FOX.

WTF: Which Tigers may move in deadline deals?

The upcoming non-waiver trade deadline, July 31, doesn’t generate the same level of excitement in Detroit Tigers fans it did a few years ago, when the team was in contention and Dave Dombrowski had free reign over Mike Ilitch’s wallet. Now operating as (at least would-be) sellers in the current trade market, the Tigers don’t have any obvious candidates to ship out, which further limits the already diminished excitement that typically surrounds this time of the baseball year.

Some commentators think that’s a sentiment that’s spreading across the sport:

[T]he trade deadline wasn’t so packed with action a year ago, and it might be even slower this season.

The trade deadline just might not matter that much anymore.

Teams knew early last year whether they were buyers or sellers. They’ve known earlier still this season. They also know the deadline doesn’t typically provide much impact.
. . .
What this means is the game doesn’t need July 31st to spur action and decisions between buying and selling status. More and more, the contenders and sellers know their status earlier in the season and sometimes even before the season. Moreover, in a game loaded with rebuilding clubs, non-contenders are perhaps more incentivized to beat the market. There is incentive for activity to begin — if it is to begin — earlier. That makes for a less dramatic deadline.

It may be worth pausing here to ask why this is happening. I don’t think it’s better information that now is providing teams with knowledge of their relative positions earlier in the season. While the new analytical approach may lead teams that do trade at the deadline to act more conservatively and uniformly and avoid badly imbalanced trades, it doesn’t make sense that that would inform teams’ earlier knowledge of their contention positions. The cause should be something new, and I suspect that cause is intentional tanking. Teams used to “find themselves out of contention” by early July; now, they begin the year that way, purposely designed to fail. This is part of the method that helped the Cubs and Astros win championships, so it’s hard to be too upset about it right now. Like other copycat strategies, though, this one soon should begin generating diminishing returns, which is why I’m glad the Tigers have chosen a more traditional rebuilding model.

To the question at hand: which current Tigers might be trade targets this month?   Continue reading

WTF: Bad Company?

american-league

Today’s article at The Hardball Times sets in print what most baseball fans already have intuited: the American League’s Central Division stinks. The article doesn’t provide much insight or analysis, but, for those who chronicle such things, its thesis statement is worth recording:

As of June 25, FanGraphs’ projected standings show the Central teams will wind up, in total, losing 88 games more than they win, with only Cleveland, as the worst of the six division winners, over .500. Since Major League Baseball split itself six ways in 1994, no division has had a worse season by that measure.

Alas, it’s nothing new. Blame it on small markets, blame it on these teams’ inability to attract the very best free agents, blame it on unwise or tightfisted ownership; heck, blame it on Midwest weather. There’s a history of this. Thirteen times in the 24 years we’re looking at, the AL Central or its National League middle-of-the-continent cousin has been the worst division in baseball. This looks like 14.

There’s more to this story, as with any other, but how much more depends upon your tolerance for a detailed observation of mediocrity. For a short-term example, I could point out that those same FanGraphs projected standings see every team in the division except Detroit playing significantly better, though still not great, over the remainder of this season. Another way of looking at that is to say that, while no one predicted greatness out of this division in 2018, the group has performed below its modest expectations to this point.

A long-term example is that, despite its collective woes, the AL Central has done a decent job of representing itself in the sport’s highest stage. Since 1995, there have been twenty-three World Series matchups. In theory, that means that forty-six different teams could have reached the playoffs’ championship round. The distribution of World-Series contenders has not been nearly so even, however. Twenty-one different teams have accounted for all forty-six World-Series openings over that span:

distribution of world series participants by team 95-17

Here’s how things look if we break down the American League’s representatives by division:

distribution of world series participants by AL division 95-17

Despite this era of AL East (really, Yankees) preeminence, the Central has managed to hold its own by representing the American League in thirty-five-percent of the World Series during that time, with four of its five teams carrying the load. To some extent, this speaks to the randomness of MLB’s playoff results, but it also isn’t exactly the picture of a division perpetually in dumpster. If nothing else, regular championship runs are a balm for the the equally regular dark days checking the summer standings.

_________________________

While we’re here visualizing some data and thinking about some 2018 projections, have a look at Nicholas Castellanos. The good news for Nick is that, according to FanGraphs, he’s already produced more value for the Tigers this season than he did all of last season. The bad news is that his offensive contributions, which are the sole driver of that production value, are trending in the wrong direction. Entering yesterday’s game, his monthly splits for 2018 looked like this:

  • March/April: 122 wRC+
  • May: 163 wRC+
  • June: 89 wRC+

(Recall that, for wRC+, 100 is average.) After going 2-5 with a double and a home run yesterday afternoon, Castellanos is back above 100 (102 wRC+) for June, but that still is a substantial tumble from his hot start. A quick glance at his other splits suggest that same-side pitching and the shift have been bugaboos for Castellanos this season, and it looks like teams are using defensive shifts on Castellanos more than ever.

______________________________________________

Previously
WTF: Busted – 6/13
WTF: Bos to the Races – 5/22
WTF: Welcome Back Kozma – 5/9

Related
2018 Detroit Tigers Season Preview
Highlights from MLB Network’s visit to Detroit Tigers spring training

Baseball Notes: Offensive Discrimination

baseball notes

Although they may continue to cite them because of their familiarity as reference points, baseball analysts largely have moved on from the historically conventional hallmarks of pitcher and batter performance– ERA and batting average (“BA”), respectively– in favor of more comprehensive metrics that provide a more accurate picture of player performance by addressing some of those traditional statistics’ blind spots.

Focusing here on hitters, some of BA’s most notable blind spots include walks; the fact that each park has different dimensions; and the significant variance in the values of different types of hits (e.g., a single versus a home run). As they have with WAR, the three main baseball-analytics websites each offer their own improved versions of BA: Baseball Prospectus’ True Average (“TAv”); Baseball-Reference’s adjusted on-base-plus-slugging (“OPS+”); and FanGraphs’ Weighed Runs Created Plus (“wRC+”). Visually, TAv looks like a batting average but is scaled every year such that an average hitter has a TAv of .260, while OPS+ and wRC+ are scaled to an average of 100.

If you’ve read baseball articles here or at those websites, then you’ve seen those metrics cited, sometimes seemingly interchangeably, in the course of an examination of hitting performance. As BP’s Rob Mains notes in the first part of a recent two-part series at that site, there’s good reason to treat these three metrics similarly: they all correlate very strongly with each other. (In other words, most batters who are, for example, average according to TAv (i.e., .260) also are average according to OPS+ and wRC+ (i.e., 100).)

There are differences between the three, however, and those differences arise because each regards the elements of batting performance slightly differently. As Rob explained:

How the three derive the numbers themselves, including their respective park factors, is pretty small ball. Bigger ball, though, it what goes into them.

  • OPS+ incorporates the same basic statistics as OPS: At-bats, hits, total bases, walks, hit by pitches, and sacrifice flies.
  • wRC+ weights singles, doubles, triples, home runs, walks, and HBPs, with the weighting changing from year to year. For example, a home run had a weight of 2.337 in 1968 but only 1.975 in 1996, reflecting the scarcity of runs in the former year. Additionally, wRC+ considers only unintentional walks.
  • TAv also weights outcomes, including strikeouts (slightly worse than other outs) and sacrifices (slightly better than other outs). TAv also includes batters reaching base on error and incorporates situational hitting[, which refers to hitting that occurs only when runners are on base: Sacrifice hits, sacrifice flies, and hitting into double and triple plays].

So while all three measures look at the same thing—hitting—they’re not doing it quite the same. For OPS+, a walk is as good as a hit, from an OBP perspective, and a home run is four times as good as a single, per SLG. FanGraphs’ wRC+ weights them, but it doesn’t weight outs, as TAv does. Only TAv considers situational hitting.

When applied to players who are especially good or bad in those areas where the three metrics diverge, the result is a lack of correlation between the three with respect to that player. (Cf. the divergent views of the three WAR metrics with respect to Robbie Ray.) Mains’ second article examines some of those players of whom TAv, OPS+, and wRC+ take different views (e.g., Barry Bonds, Kris Bryant, Ian Kinsler, and David Ortiz) before explaining a few general conclusions:

[TAv, OPS+, and wRC+ are] very similar. You can use any of them and feel confident that you’re usually capturing the key characteristics of a batter.

If you want to drill down, though, here are the differences I found:

  • The lack of weighting in OPS+ means that it gives slightly less weight to singles and slightly more weight to home runs and walks than TAv and wRC+.

  • TAv’s inclusion of situational hitting means that batters who are extremely good or bad at avoiding double plays are going to get rewarded or penalized. (Situational hitting also includes bunting, but nobody does that anymore anyway.)

  • The black box factor in these calculations is park factors. Each of the three sites calculates them their own way. They can account for some changes, though not in a predictable or transparent way like high walk totals or low GIDP rates can.

I expect I’ll continue to use these three metrics somewhat interchangeably in articles at this site, although my preexisting (mostly uneducated) preferences for TAv and wRC+ likely will continue. Articles like Rob’s serve as both an important reminder that, at the edges, these updated metrics aren’t exactly the same and an entry point into thinking more precisely about what we ourselves value in the process of evaluating hitter performance.

___________________________________________________________________

Previously
Baseball Notes: Current Issues Roundup
Baseball Notes: Baseball’s growth spurt, visualized

Baseball Notes: The WAR on Robbie Ray
Baseball Notes: Save Tonight
Baseball Notes: Current Issues Roundup
Baseball Notes: The In-Game Half Lives of Professional Pitchers
Baseball Notes: Rule Interpretation Unintentionally Shifts Power to Outfielders?
Baseball Notes: Lineup Protection
Baseball Notes: The Crux of the Statistical Biscuit
Baseball Notes: Looking Out for Number One
Baseball Notes: Preview

WTF: Busted

mlbf_2147243383_th_48

One swing of the bat. Detroit Tigers radio broadcaster and former catcher Jim Price always said that this team, particularly its harder-hitting versions in the earlier part of this decade, could change its fate with one swing of the bat. While Price’s statement always came from a place of optimism, the line was no less true last night, albeit in a far unhappier context, when Miguel Cabrera swung through a 1-1 breaking ball from Minnesota’s Jake Odorizzi in the bottom of the third inning of what eventually would be a 6-4 loss to the Twins and ruptured a tendon in his left biceps. Later that night the news that would become this morning’s headlines arrived: Cabrera was done for the year.

The 2018 season began as a hopeful one for Cabrera. After missing significant time in 2015 and 2017 with leg and back injuries, he reportedly entered the current in good health and physical condition. Early returns on the field backed up that story. His March/April (154 wRC+) was one of his best starts of the last five years. Some trouble surfaced at the end of April, though, when spasms in his left biceps caused him to leave an April 29 game in Baltimore.  A few days later, he made his return in a game in Kansas City but again left early, this time hitting the disabled list with a hamstring strain.

Cabrera, seemingly frustrated, was in no rush to return from the hamstring injury:

Nobody appreciates when you play hurt, so I’m going to take my time and play when I’m good. I play a lot of years hurt here in Detroit. They don’t appreciate that. When you are doing bad, they crush you. They crush you. They say you are bad. You should go home. You don’t deserve anything. That you are old. I say “OK. I’m done playing hurt.” When you are going good they say, “Oh, oh, you’re good.” Now I take my time.

That Kansas City game ended up being the only game in which he played in the month of May.

After a twenty-six-game absence, Cabrera returned to action in a home win against the Blue Jays on June 1 and didn’t miss a game this month. He struggled (June: .244/.367/.293, 86 wRC+) in his return, however, exhibiting weak power at the plate. And now he’s done for the season. His 2018, comprised essentially of a good month and a bad half-month, sum to .299/.395/.448, 128 wRC+, 3 HR, 0.8 fWAR/0.4 bWAR/0.5 WARP. In large part due to the time he missed prior to last night’s injury, Cabrera has been the Tigers’ seventh-most-valuable player in 2018, behind Jeimer Candelario, Leonys Martín, Nicholas Castellanos, Jose Iglesias, Matt Boyd, and Joe Jimenez.

Now is the time on Sprockets when we provide the obligatory reminder that Cabrera is thirty-five years old and has, beyond 2018, a minimum of five years and $16 a2 million remaining on his contract. While I’ve argued it wasn’t crazy to believe that Cabrera might continue to earn that contract for a few more seasons if you believe that a win currently is worth $10 million, Cabrera already was likely to be shifting to DH on a much more consistent basis in 2019 (following Victor Martinez’s exit), and this injury raises new and serious questions about his ability to contribute going forward.

Comments from doctors and trainers experienced with this type of injury will appear in the coming days and provide a somewhat clearer picture of Cabrera’s possible future with the Tigers. In the meantime, I suggest we might consider the case of former Tiger Cameron Maybin, who, while playing for the San Diego Padres, ruptured a tendon in his left biceps four years ago while making a defensive play during a spring training game. Maybin, who was a month shy of his twenty-seventh birthday at the time and had missed most of the prior season with wrist and knee injuries, chose a rest-and-rehabilitation approach over surgery and was given a two-to-three-month return timetable. Maybin was back in the Padres’ lineup faster than that, though, missing only about a month of the regular season. (Articles about Maybin at the time note that the injury is more common in football and cite the case of John Elway, who also chose the non-surgical route and returned to action after just three weeks off.) Maybin’s somewhat stunted and injury-riddled career makes it difficult to compare his performance before and after the injury. Moreover, the numerous differences between Cabrera and Maybin, including age, body type, and style of play, probably limit the usefulness of the comparison for the purpose of understanding Cabrera’s prognosis. In addition, the fact that Cabrera is choosing surgery suggests that his injury is more severe than Maybin’s, although there aren’t many details available right now.

With Cabrera out, the already probable likelihood that the Tigers try to sell at the trade deadline becomes a certainty. Last night’s loss bumped Detroit out of second place in the AL Central, and one assumes that the team will continue to follow that trajectory in the standings. Keep an eye on some of those players listed above, especially Iglesias and Martín, as trade candidates next month. Expect General Manager Al Avila to field plenty of calls about Michael Fulmer. Look for the new-faces trend to continue. Hope that Cabrera can make a full and productive return in 2019.

______________________________________________

Previously
WTF: Bos to the Races – 5/22
WTF: Welcome Back Kozma – 5/9

Related
2018 Detroit Tigers Season Preview
Highlights from MLB Network’s visit to Detroit Tigers spring training