One of the marks of a smart baseball writer is the ability to sense a trend, research its existence and nature, place her findings in context, and present her conclusions in a way that meaningfully educates readers. Inherent in this ability is the wherewithal to know when to stop researching a trend or pressing on a concept, realizing that the fruits of the work have been or soon will be exhausted. Sometimes a person who is not a “smart baseball writer” by the foregoing definition will noodle about on an idea for so long, he’ll end up with a small pile of research that no longer has any bearing on any meaningful conclusions.
Two years ago, I decided to investigate a hunch that the Detroit Tigers were having trouble scoring runs late in games. My initial research mostly seemed to support my hypothesis, and a follow-up look appeared to confirm it more strongly. More than merely interesting (and fleetingly self-satisfying), it also was informatively concerning, because it placed the team’s well-known bullpen problems in a more nuanced light: relief-pitching woes alone weren’t the problem, because the lack of late-game scoring was compounding the problem of surrendering leads during the final frames. As strange as it seemed, the Tigers had interrelated shortcomings on both sides of the plate.
One comment I received in the course of sharing those findings stuck with me: I needed to place this information in context. After all, there are plausible reasons to believe that all teams might, perhaps to varying extents, experience decreased run production in the late innings.
And so it was that, two years later, I finally discovered Retrosheet, a site that compiles inning-by-inning scoring data to a more useful degree than the resources I’d utilized back in 2013. What follows are two graphs of the inning-by-inning scoring of sixteen teams for the 2014 season. The first charts the eight playoff teams, and the second charts the eight worst teams. Each also has a plot (the black line) for the league average per-inning scoring.
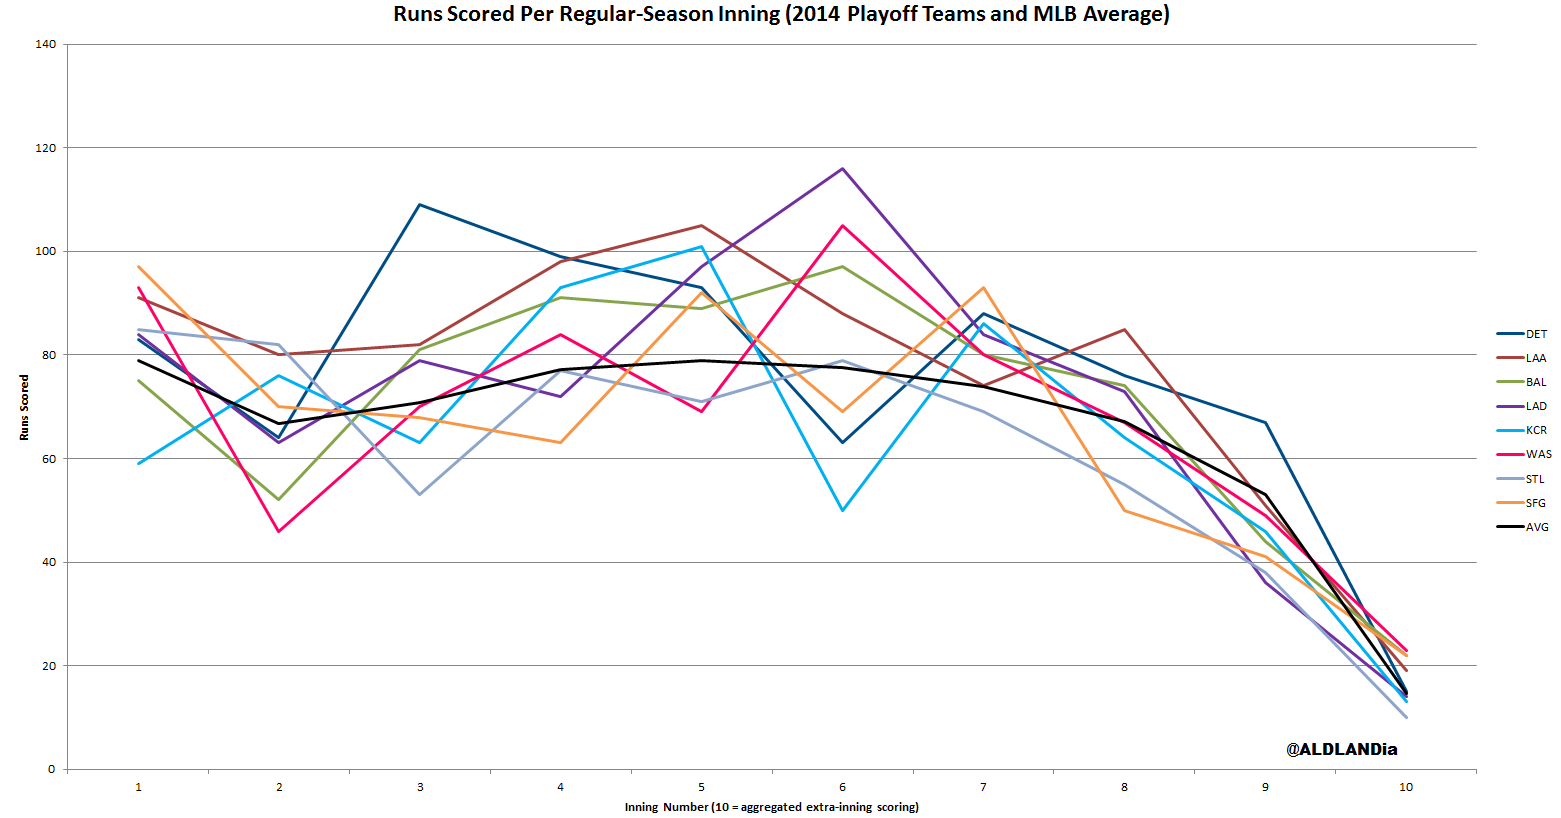
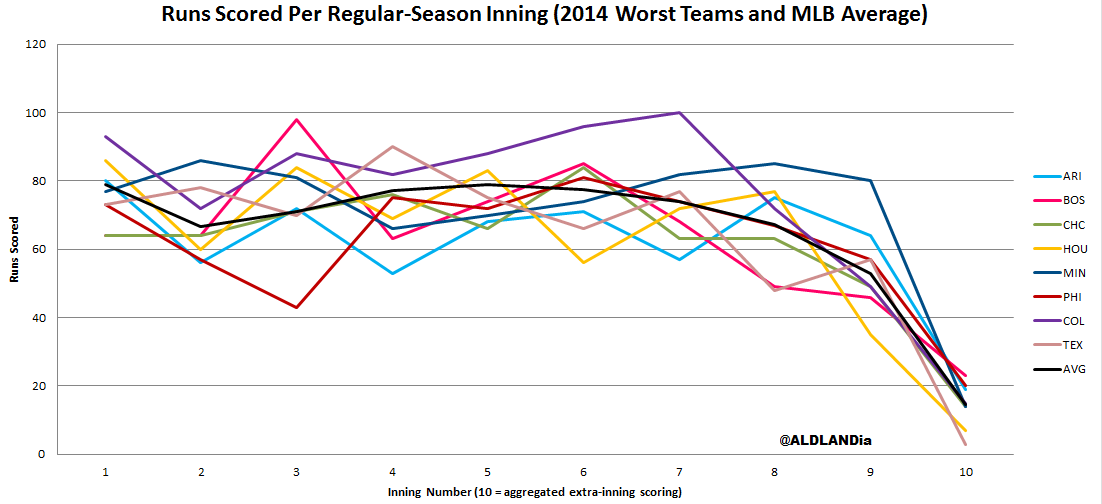
(Click both to enlarge)
An obvious thing to do would be to plot these numbers as averages of total runs scored, but then we wouldn’t get to see the Rockies soar above the league in the second graph, and, for the purpose of comparing teams, viewing the actual number of runs scored does make some sense.
I’ve been sitting on these for about a week, and the best use for this data I’ve come up with is as a sort of baseball RunPee. If you’re a Tigers fan, make sure you’re in your seat before the third inning. If you’re in L.A., do not leave to get a Dodger Dog in the sixth inning. If you like the Royals, though, the sixth would make a great time for a dip in the Kauffman Stadium fountain.
If there’s any visually detectable trend between the two graphs, it might be that the successful teams did more of their scoring early, and less of it late, than the unsuccessful ones. All the Twins’ above-average production in the seventh, eighth, and ninth earned them was a 70-92 record and last place in the AL Central. Of course, returning to the Tigers, Detroit may have a case for the most solidly above-average late-game scoring amongst the playoff teams, and they won the AL Central. Who knows? Maybe you do, or maybe you at least have an idea. If you do, leave a note in the comment section. If you’re just planning your in-game bathroom break and hot-pretzel run, that’s fine too.

A thought, including the 10th inning in these figures is a bit misleading for two reasons. Most games don’t go to extra innings, and those that do are likely to have fewer runs because the bottom half of the tenth could end early (a team could be racking up hits and runs at this point, but only get enough to go ahead with outs remaining). The first problem could be solved by dividing by the number of times that inning was played. The second problem won’t be solved by that and also affects the 9th inning.
It would be interesting to provide a statistical test for whether or a particular team’s run distribution (through 9 innings) is consistent with a flat distribution (equal expected number of runs per inning) and again the same test for the league average.
The “10th inning” figures are different than those for the first nine innings, as presented, but I don’t think including them impairs the presentation of the first nine. I don’t see it as a problem as much as additional information that doesn’t quite fit but wasn’t difficult to include.
I am glad to send anyone the worksheets I used for this, which contain the data from Retrosheet for every team from the 2014 season.
Working on a legislative application next: http://politics.blog.ajc.com/2015/03/03/religious-liberty-bill-passes-during-a-bathroom-break/.
A couple more notes on the Twins, since I singled them out above. First, I took another look at their total output for 2014 and was a little surprised to see that they were seventh-best in terms of runs scored per game (4.41). How did they finish twenty games out of first in the Central? Their defense blew. Only one team allowed more runs per game, only two allowed a worse opposing True Average, only four posted a worse FIP, and not one team was worse in the field in terms of Defensive Efficiency.
Despite all that, there was a shining diamond in the rough roughage: starting pitcher Phil Hughes. Minnesota rode him hard: 209 2/3 innings pitched made for the busiest season of his career. During the course of his thirty-two starts, though, he only allowed sixteen walks! The only season in which he allowed fewer than sixteen walks was his second, in 2008, when he allowed fifteen walks . . . in thirty-four innings. He only bested his 1.13 WHIP once, when he allowed 1.12 in eighty-six innings in 2009. 2.68 FIP? Best of his career. According to the pitching component of WARP, only the two Cy-Young winners, Cory Kluber and Clayton Kershaw, had better seasons in 2014. Not bad, which is what the rest of the staff was.