On baseball robots, probabilities, and getting fooled again

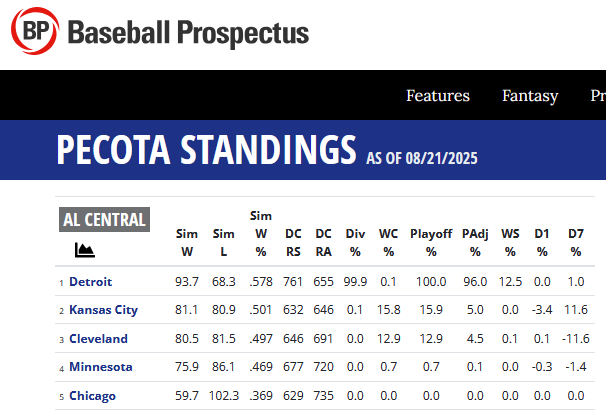
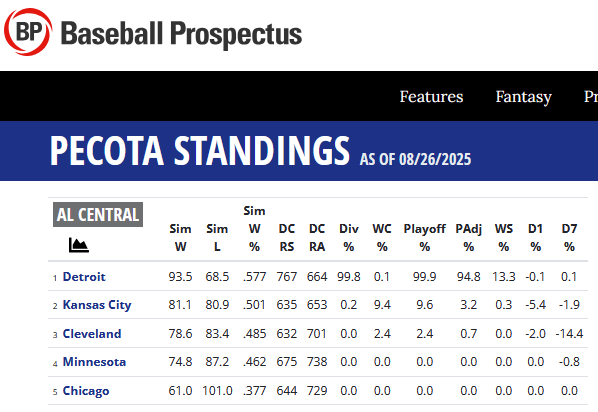
What is this nonsense? Last week, Baseball Prospectus’ PECOTA declared it a one-hundred-percent certainty that the Detroit Tigers would appear in the 2025 MLB playoffs. Today, though, the ostensible gold standard in baseball-projection machines has engaged in a very unfortunate bit of retrenchment:

To be sure, I would not blame anybody for downgrading Detroit after Tarik Skubal surrendered a grand slam during a five-run seventh inning that ignominiously crowned a Tigers loss last night to a vagrant team playing in a minor-league park. Far from the August heater the team generated to fuel their run to the 2024 postseason, however, these Tigers have struggled in the second half with the likes of the Twins, Pirates, and A’s in a manner belying a true talent level perhaps somewhere below their overall winning percentage. And Javy Baez doing that bad thing again feels like a microcosm of team-wide regression trends in action:

But BP’s PECOTA conceded none of that reasonable skepticism. It said this final outcome was a guaranteed certainty; no hedge, error margin, or other reservation of any kind. Presumably, it knew that Skubal could have a bad night, Baez could turn back into a pumpkin, and Jack Flaherty could continue to melt down, but it said it was not concerned. Having crossed that triple-digit threshold of certitude, it probably did not love what it saw in Sacramento last night, but one envisioned PECOTA taking that on the chin with an unwavering forward stare into a known and unavoidable future.

In short, once you go to 100%, you simply cannot go back. Again a concession from me: I will grant force majeure: If the season suddenly and prematurely ended due to a public-health catastrophe, war, or series of natural or Manfred-made disasters, then PECOTA probably gets a pass. Short of that, though? If 100% means Fool me once, shame on you. But fool me twice, baseball robot? My promise to the ALDLAND readers is that I will not be fooled again.

___________________________________________________________________

Previously
Death, Taxes, and the Detroit Tigers in the 2025 MLB playoffs?
More Likely Than Not: The 2025 Detroit Tigers are winning, and winning matters
Maximum Tork: How Spencer Torkelson is cranking up his hot start in 2025

Before you accuse me, take a look at Jake Rogers
Is it Tiger Time? Tarik Skubal says so

Death, Taxes, and the Detroit Tigers in the 2025 MLB Playoffs?

You serious, Clark? Yes. As basically first reported by ALDLAND.com months ago, the Detroit Tigers have clinched a spot in the 2025 MLB playoffs. Look for yourself:

If that isn’t surprising to you, I am projecting with 100% certainty that’s so because you are an ALDLAND reader. Before the current season even started, we told you that Baseball Prospectus told you that Detroit had close to no shot– 19.9%!– at returning to the playoffs. At the same time, we also told you why that was very wrong. For their part, the Tigers immediately began proving us very right and Baseball Prospectus very wrong. And now, at last, Baseball Prospectus has thrown in the towel: Rob Manfred himself cannot stop this team.

Arrange your affairs accordingly. We’ll see you in October.

___________________________________________________________________

Previously
More Likely Than Not: The 2025 Detroit Tigers are winning, and winning matters
Maximum Tork: How Spencer Torkelson is cranking up his hot start in 2025

Before you accuse me, take a look at Jake Rogers
Is it Tiger Time? Tarik Skubal says so

Baseball Notes: New WAR Without an Act of Congress

During the 2018-19 MLB offseason, Baseball Prospectus revamped the offensive component of its main player-performance metric, WARP. For some people, this resulted in a significant alteration in the way they thought about the then-more-recent performances of some of the game’s top players, chiefly Miguel Cabrera and Mike Trout and the divisive MVP races of 2012-13 between those two.

Now it’s FanGraphs’ turn to update its player-performance metric, WAR (a/k/a “fWAR”). Their tweaks don’t appear to be as methodologically fundamental as what BP did to WARP, but they did result in some slight– less than a win per season at the extremes– adjustments to players’ career fWAR numbers dating back to 2016. Among those who some people now will think are better players than they thought they were a few days ago (i.e., those whose fWAR numbers increased the most) are a batch of current and (mostly) former Detroit Tigers:

  • J.D. Martinez: +2.9
  • Tucker Barnhart: +2.0
  • Gio Urshela: +1.3
  • Austin Romine: +1.1

Avisail Garcia, meanwhile, was docked 1.4 fWAR, and Leonys Martin dropped 1.1 fWAR.

The full list of players seeing a shift of at least one win in their 2016-23 fWAR totals is here.

___________________________________________________________________

Previously
Baseball Notes: Offensive Discrimination
Baseball Notes: Current Issues Roundup
Baseball Notes: Baseball’s growth spurt, visualized

Baseball Notes: The WAR on Robbie Ray
Baseball Notes: Save Tonight
Baseball Notes: Current Issues Roundup
Baseball Notes: The In-Game Half Lives of Professional Pitchers
Baseball Notes: Rule Interpretation Unintentionally Shifts Power to Outfielders?
Baseball Notes: Lineup Protection
Baseball Notes: The Crux of the Statistical Biscuit

Baseball Notes: Looking Out for Number One
Baseball Notes: Preview

Related
Miguel Cabrera continues to shine in the DRC era
Miguel Cabrera further bolstered by sabermetric update
Trout vs. Cabrera, and Aging with DRC+ (via Baseball Prospectus)
Miguel Cabrera in the bWAR era

Everyone’s Going to be Worse: 2024 Detroit Tigers Season Preview Notes

Many have published their previews of the 2024 Detroit Tigers season. What follows are my notes from those previews, primarily the corresponding Baseball Prospectus annual chapter and its PECOTA projections, along with my own annotations and recent news updates.

Everyone’s Going to be Worse

Only the really hopeless Athletics and White Sox scored fewer runs than the Tigers in 2023. The reason the Tigers’ offensive outlook today isn’t hopeless (as any good Detroit fan will tell you too many times) is because Spencer Torkelson had a really good second half last season, and that’s going to be his new baseline for his major-league career, which really will begin this year. His 121 wRC+ and a homer every 16.2 plate appearances– his second half– sounds a lot more like a good first baseman than a 95 wRC+ and a homer every 31.3 plate appearances– his first half. Torkelson is the case study that proves Tigers fans’ optimism for 2024 is grounded in reality: all good trends will be banked as established new normals, while any bad trends have reasonable explanations and therefore safely may and should be ignored.

The cold baseball computer isn’t buying the Midwestern thaw. PECOTA projects every Tigers hitter listed in the team’s BP annual chapter to be worse in 2024 than he was in 2023. Can that sentence really be true? I don’t know whether it can but it is. Sure, some of these guys are Not Ready For Primetime Players, minors types whose prospect statuses merit their mention but, at least for this year, understandably don’t project as majors talent. But it really is bad news for all of the alleged major-league talent.

Continue reading

Reining in the Moneyball Revolution’s Chief Excess, Twenty Years Later

What was the point of Moneyball? Nerds said on-base percentage is better than batting average and were technically correct on that narrow point? The real answer, of course, is that cheap owners‘ teams still can win by excelling at identifying and exploiting budget-friendly market inefficiencies. But when Brad Pitt says “on-base percentage is all we’re looking at now,” people tend to focus on that part and forget the rest.

Reaching base, however a player does it, is good, and counting only some ways players reach base necessarily misses relevant data points. By including walks and hits-by-pitch (“hit-by-pitches”?), on-base percentage (“OBP”) does paint a more complete picture of a baseball player’s offensive production than does batting average (“BA”), which only counts hits. The responsive inclination to look first to OBP rather than the traditional go-to, BA, thus is understandable.

Those comfortable with taking this new step, especially the early OBP adopters, often did so zealously and callously, even as they cloaked themselves in the mantle of measured reason. And when they did so, they very often took a second step: banishment of BA. Elevation of OBP was not enough; BA, the very embodiment of the old and impure way of thinking, must be cast out.

For the SABR revolutionaries, like not a few revolutionaries before them and to mix corporeal metaphors, that second step proved to be something of an overreach. As it turns out, the ancients were in fact onto something with BA, and there was something in that something that deserved to be conserved and carried forward through the revolutionary wave. BA, Eli Ben-Porat writes, not only deserves its place in baseball’s basic offensive statistic trinity– the Triple Slash Line of BA/OBP/SLG– but is the only component that actually belongs there.

As Ben-Porat explained over the weekend: “Dismissing batting average, in this author’s view, is just plain wrong. It is statistically significant in terms of predicting team runs, and on a per point basis, the most impactful component of” the building blocks of the triple slash line. After all, BA is a big part of both OBP and slugging percentage (“SLG”). And because of the way OBP weighs walks relative to hits, it can obscure the value of the offensive production it presents; in other words, not all OBPs are created equal. To Billy Beane’s point, it is important to account for a batter’s walks, but a hit– even a single– is better than a walk. Two players thus could post identical OBPs but have gotten there in much different fashion. Dumping BA would mask the real significance of a light-hitting, ball-taking batter’s empty OBP that matched the same mark of a more balanced player who hit more than he walked. Ben-Porat shows both that BA still matters and that presenting OBP without BA really makes the former less useful.

Whether Ben-Porat’s proposed adoption of an even more elemental triple slash line that omits the BA components of OBP and SLG and leaves the remainders (i.e., BA/BB%/ISO) catches on is another question. For now, rest with the satisfaction that you aren’t wrong to not get irritated when you see a player’s BA displayed during an upcoming MLB telecast.

__________________________________________________

Related
Why I’m not going to see Moneyball
Baseball Notes: Offensive Discrimination
Window Shopping: Ian Kinsler’s Walking, Not Running
Trout vs. Cabrera, and Aging with DRC+

RKB: Shifting the D to See Whether Analytics Drives the Motor City’s Baseball Team

The Detroit Tigers have the reputation of being a team late to baseball’s new analytical revolution, but they quietly have been making front-office hires (no, Brad Ausmus did not count) purportedly to try to catch up in that area, and there’s evidence that it’s happening. For example, two weeks ago, something occurredfor what I believe to be the first time in Tigers history, when manager Ron Gardenhire cited input from the analyitics department– excuse me, “analytic department”– as the reason for a decision he’d made:

If you’re excited — or angry — about seeing Jeimer Candelario in the lead-off spot Wednesday night, then feel to credit — or blame — the Detroit Tigers analytics department.

Tigers manager Ron Gardenhire said the recent spate of roster changes prompted a consultation with the club’s analytics and research department in an effort to find an ideal batting order.

“We did some research and the analytic department put all the data in there to try to see what gives up our best opportunities,” Gardenhire said. “(Candelario’s) name came up first as lead-off.”

Just the one analytic so far, but it’s a start. Now that we know the Tigers have sabermetric analysts and those analysts convey strategic input to the coaching staff, it’s fair to inquire into the quality of that input. As it turned out with respect to the above example, Candelario only hit leadoff for two games, and while he performed well (four hits, including a double and home run, and two strikeouts in eight plate appearances), it did not seem to be a part of Gardenhire’s long-term plan. Very likely coincidentally, the team lost both of those games, and Gardenhire moved Candelario back to fifth, where he’s hit for most of the season, for the next game, a win. As Lindbergh and Miller’s The Only Rule Is It Has To Work reminds, it’s one thing to develop sabermetrically informed strategies and another to implement them with coaches and players. (And, as beat writer Evan Woodbery pointed out in the article quoting Gardenhire, Detroit didn’t have many good options for the leadoff position anyway.)

More recently, Tigers observers and fans have cited with excitement a data point on defensive shifts an FSD producer pointed out over the weekend as more good evidence in this area, even suggesting that the team was becoming a leader (first place!) in the realm of new analytics-based strategy:

The irony of the timing of this was that it came as lead Baseball Prospectus writer Russell Carleton was in the process of dismantling the notion of the shift as a useful defensive strategy.  Continue reading

Miguel Cabrera in the bWAR era

miguel cabrera 2003

I have been monitoring the effects of Baseball Prospectus’ recent modifications to its wins-above-replacement metric, WARP, on Miguel Cabrera’s career valuation numbers, and, on the whole, the results for Cabrera have been positive.

On Monday, former Baseball Prospectus editor in chief Ben Lindbergh discussed the ways in which WAR metrics always are in some state of flux as they incorporate newly available information and adapt to significant changes in game strategy and play:

In a sense, it’s unsettling that WAR is always in motion. Batting average may not be an accurate indicator of overall (or even offensive) value, but barring an overturned ruling by an official scorer or an unearthed error in archaic records, it always stays the same. Ted Williams will always have hit .406 in 1941, but his FanGraphs WAR for that season was 11.9 in 2011, and today it’s 11.0. That’s one reason why WAR values may never achieve the emotional resonance of evocative stats such as .406, 56, or 755, or even milestones like 3,000 hits or 500 homers.

WAR reminds us that objective truth tends to be slippery. And the metric is likely to get more unstable before it someday settles down. None of the big three versions of WAR(P) currently incorporates Statcast data. Thus far, MLBAM has drawn on that data to quantify aspects of player production without generating one unified number, but Tango describes it as “inevitable” that “eventually they will get rolled into one Statcast WAR metric.” He acknowledges that WAR’s amorphousness may make some fans more hesitant to trust it. Even so, he says, “Our focus should be on representing the truth as best we can estimate it. And it’s the truth that will attract the people.”

Baseball-Reference founder Sean Forman has responded to criticism of WAR’s mutability—not to mention its multiple implementations—by comparing it to Gross Domestic Product (GDP), another complex statistic that also changes retroactively and comes in more than one form. WAR works the way all science does: Discoveries are scrutinized, assumptions are examined, errors are rooted out, and breakthrough by breakthrough, we learn.

The focus of Lindbergh’s article was on the ways in which teams are straying from the traditional sequencing of starting and relief pitchers– frequently referred to as “the opener” strategy– are affecting WAR calculations, particularly Baseball-References bWAR.

An obstacle I encountered in analyzing changes in Cabrera’s WARP is that BP doesn’t keep a public record of statistical changes. By contrast, as Lindbergh helpfully noted, B-R does keep a public bWAR index, which effectively permits the tracking of changes to individual players’ seasonal bWAR totals on a daily basis since March 29, 2013.

In light of my prior documentation of the recent set of changes to Cabrera’s career seasonal WARP totals, I decided to take a quick and very rough look at how Cabrera’s seasonal bWAR totals had changed over the last six years. What I found was that, at least through 2012 (covering the first ten years of his career, which was all that was included in the March 29, 2013 data set), the difference was negligible. Some years’ bWAR numbers had increased a bit, some had decreased a bit, and some didn’t change; in total, the aggregate difference was -0.13 bWAR over those ten seasons. Doing a similar thing for the next six seasons by using the bWAR value from the first available date on the calendar year immediately following the completed season yielded a similar mix of results, with an aggregate difference of +0.38 bWAR. Combined, the total change is an increase of 0.25 bWAR, basically a negligible amount. Coincidentally, “negligible” also describes the value over replacement blog post (VORBP) of what you’ve just read.

_________________________________________________________

Previously
Miguel Cabrera continues to shine in the DRC era
Miguel Cabrera further bolstered by sabermetric update
Trout vs. Cabrera, and Aging with DRC+ (via Baseball Prospectus)

Average Hit Band: Photograph of the DRC Era’s New Normal

This MLB offseason, while arguably a bit chilly by hot stove standards, did offer baseball fans a hot new hitting metric in Baseball Prospectus’ Deserved Runs Created Plus (DRC+). In the words of its creators, DRC+ is “designed to parse out more accurately . . . batters’ expected individual contributions — separate from all other player and environmental factors — to their teams’ offensive production.” (My summary of that introductory article, which was nominated for a SABR research award, can be found through here.)

Unlike traditional, rate-based hitting metrics such as batting average (BA) and on-base percentage (OBP), DRC+ is an index statistic, meaning that it’s arranged to indicate the degree to which a player is above or below average, where 100 represents average. As part of its DRC+ rollout, BP published an homage to rate statistics (link and summary available through here) that touts their simple approach to delivering contextual information.

This undoubtedly is a user advantage for metrics like DRC+, but, by placing the focus so squarely on the average reference point, the initial transition from the rate-stat world of BA/OBP/SLG to the index-stat world of DRC+ can be a little bit rough. To help smooth things, I thought it would be beneficial to illustrate the translation with a quick look at all of the hitters who had “average,” according to DRC+, seasons at the plate in 2018.

Last season, eleven batters finished with at least 275 plate appearances and DRC+ marks of 100. As their traditional slash lines illustrate, they got to that point in a variety of ways.

The ranges for these eleven on each of the traditional hitting rate statistics are:

  • BA: .224 – .280
  • OBP: .294 – .351
  • SLG: .359 – .484

Obviously, because of the multitude of factors DRC+ considers, including both player-performance factors and environmental factors, these rate bands only serve as rough guidelines for fans making the mental shift from the rate world of BA/OBP to DRC+ that want a little help finding their bearings. (Also keep in mind that these “average” slash-line bands will vary from year to year. For example, in 1998, there were four players with at least 275 PA who posted DRC+ marks of 100, Matt Williams, Devon White, Luis Alicea, and Robin Ventura: BA between .263 and .279; OBP between .327 and .372; and SLG between .425 and .456. For reference, Mark McGwire, .299/.470/.752, led MLB with a DRC+ of 211 that year.)

_________________________________________________________

Previously
Miguel Cabrera continues to shine in the DRC era
Miguel Cabrera further bolstered by sabermetric update
Trout vs. Cabrera, and Aging with DRC+ (via Baseball Prospectus)

Related
The Best Baseball Research of the Past Year (2018)

The Best Baseball Research of the Past Year

20190207_133211

Once again, the Society for American Baseball Research has chosen fifteen (non-ALDLAND) finalists for awards in the areas of contemporary and historical baseball analysis and commentary.

My latest post at Banished to the Pen highlights each finalist. The winners will be announced on Sunday.

The full post is available here.

Miguel Cabrera continues to shine in the DRC era

Last month, I wrote about the substantial change in the way Baseball Prospectus is measuring hitter value and the significance of that change to Miguel Cabrera’s statistical legacy. Yesterday morning, BP announced “updates” to its hitter-value metric, DRC+. The description of the updates is pretty technical, and I commend you to the linked article if you want to get into the nuts and bolts, to the extent BP exposes them to the public. The short story seems to be that the original version of DRC+ undervalued two types of players: 1) those who play many of their games in “extreme ballparks” (Coors Field is the only one I’ve seen mentioned in the early DRC+ critiques and the update article, but I assume others are included) and 2) “extreme”-output hitters who do one thing really well (the examples I’ve seen discussed usually include singles hitters like Tony Gwynn and Ichiro Suzuki).

For Cabrera, the update credited him with even more productive value, adding almost two wins to his career total. The following chart, which I’ve adapted from the one I created for the BttP article, compares Cabrera’s career and season-by-season win totals under three different WARP regimes: a) TAv-based WARP; b) the original DRC+-based WARP; and c) the updated DRC+-based WARP.

cabrera warp drc update

(Notes: TAv-based WARP isn’t available for 2018, which affects the WARP totals in the bottom row. Orange highlighting signals seasons in which TAv and original DRC+ disagree about whether Cabrera’s offense was above or below average. Updated DRC+ was consistent with original DRC+ in that respect.)

Looking first at the table’s seventh column, the DRC+ update added to Cabrera’s totals, not infrequently by double digits, in every season save two minor decreases in 2007 and 2014. Looking next to the table’s final column, though, there isn’t really a consistent correlation between either the direction or magnitude of the update’s DRC+ adjustments and WARP; indeed, in 2008 and 2012, the update resulted in increases in Cabrera’s DRC+ but decreases in WARP. As the totals in the bottom row indicate, however, overall, the DRC+ update boosted Cabrera’s career WARP total by 1.8 wins. Not bad.

Here I will add the same caveat I included in my previous article on this subject, which is that I don’t have a deep enough understanding of DRC+, a proprietary metric, to explain with any further detail why this happened. (I also will note that, because BP does not archive its statistical reports from prior metric regimes, the foregoing is reliant on data previously captured by Archive.org’s Wayback Machine and me.)

What outsiders like us can say is that the Deserved-Runs-Created era has been good to Cabrera, from validating his MVP wins over Mike Trout to restoring all of his season-by-season WARP numbers into the black to, following yesterday’s update, increasing his career WARP total. None of this is likely to stir any concern on the parts of Al Avila or Chris Ilitch that Cabrera suddenly is on track to challenge for MVP votes in 2023 such that his $30 million option for his age-forty-one season in 2024 will vest, but the growing– even if by very small amounts– recognition of Cabrera’s past achievements is nice to see.

_________________________________________________________

Previously
Miguel Cabrera further bolstered by sabermetric update
Trout vs. Cabrera, and Aging with DRC+ (via Baseball Prospectus)