
Thanks to MLB Advanced Media’s new Statcast technology, fans can learn more than ever about the activity taking place on the field (and off it) during a baseball game. One such aspect into which Statcast offers insight is exit velocity, which refers to the speed with which a batted ball leaves a hitter’s bat. These velocities can communicate something meaningful about batter success. (Very generally, and possibly very obviously, higher exit velocity is better.)
Statcast came on-line last season, but there were significant flaws in its batted-ball data gathering in 2015. The shortcomings in the 2015 data will affect any analysis that relies on Statcast information from that season, and while Statcast seems to be doing a better job of gathering a more complete set of batted-ball data this year, some imperfections remain. Fortunately, it appears that those imperfections– apparently due in part to differences in hardware installations at each park– can be accounted for. Baseball Prospectus now publishes something called adjusted exit velocity, which aims to control for various influences on Statcast-measured exit velocity that are outside batters’ control. (None of those adjustments can recapture the data the system failed to collect in 2015, of course.)
Early in the season, I went to the Statcast well to compare home runs by Anthony Gose and Giancarlo Stanton. The purpose of this post is not to undermine lazy media narratives but to present a simple comparison between various Detroit Tigers’ adjusted exit velocities in 2015 and so far in 2016.
Keeping in mind the imperfections in the source data, here are the 2015 and to-date 2016 adjusted exit velocities (in miles per hour) of the Tigers’ primary hitters who played for the team in both seasons:
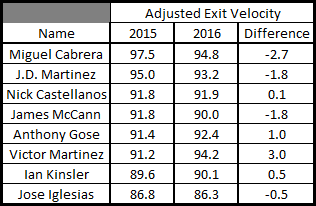
While recalling that we still are dealing with small sample sizes for 2016, particularly for James McCann, who’s spent much of the young season injured, and Anthony Gose, who now is down in the minors, I’d guess that the differences in adjusted exit velocity roughly comport with how well fans think each hitter is performing this year: Miguel Cabrera hasn’t heated up yet; J.D. Martinez has been struggling since moving to the second spot in the lineup after a hot start batting deeper in the order; Nick Castellanos has been breaking out; Victor Martinez is healthy again and showing it; Ian Kinsler seems to be in fine form yet again (credit those Jack White-designed bats?); and Jose Iglesias is continuing to rely on weak contact.
Cabrera was second overall in adjusted exit velocity last season, so his drop-off seems like a possible source of concern. Sluggers like Cabrera can take a while to warm up, though, so it’s not unreasonable to think that his adjusted exit velocity will climb as the current season progresses. (Cf. Giancarlo Stanton, 2015’s adjusted exit velocity champ, who, so far in 2016, is down 9.4 MPH.)
The elder Martinez has the largest change of any of the highlighted batters in either direction, but his 2015 doesn’t offer much of a baseline because he was playing through obvious injury. It therefore is reasonable to assume that some portion of that +3.0 MPH of adjusted exit velocity is due to a return to health.
Not only do these changes in adjusted exit velocity correlate with anecdotal observations of these players this season, but they also– loosely but consistently across this sample– track changes in raw power (measured as isolated power, or ISO):

Each of the eight data points appears either in the first or third quadrant of the above graph, indicating that, for each player, the change in his adjusted exit velocity and the change in his ISO from 2015 to 2016 moved in the same direction (i.e., either positive or negative).
Research based on the limited Statcast exit velocity available supports the preliminary conclusions that “exit velocity could stabilize relatively quickly, that it is repeatable, and that in-season conclusions based on the data could be meaningful.” Still, with so little data available in this area, it is difficult to place heavy reliance on this information.
Noting changes in adjusted exit velocity, like other changes (e.g., a pitcher’s fastball velocity, a batter’s out-of-zone swing rates) in players’ games, nevertheless strikes me as a worthwhile pursuit in the course of keeping an eye on possible changes in players’ performance abilities. Part of the appeal of tracking things like exit velocity, pitch velocity, and swing rates is that they represent the human inputs of baseball, as compared with results-based measurements like batting average. If we want a better understanding of what’s happening with a player, it makes sense that we should want to look as closely as we can at what the player is doing, especially where the alternative– measuring the results of the subject player’s actions– necessarily incorporates influences outside the player’s direct control.
As a parting shot before exiting this post, here are the adjusted exit velocity numbers for two 2016 Tigers who weren’t on the team in 2015:

For Justin Upton and Jarrod Saltalamacchia, I am as much interested in the adjusted velocity numbers as I am in the season-to-season changes. Upton is off to a bad start with his new team, as everyone knows, but his 2016 adjusted exit velocity still is the third-highest of any of Detroit’s regular hitters this year. If he can remember how to make contact (small thing I know!) he should snap back into form. I’ve already written about the catching situation twice this year, and Saltalamacchia got off to a likely unsustainable hot start filling in for McCann last month, but all these numbers do is tilt the scale even further in favor of giving more starts behind the plate to the switch-hitting veteran who can hit for a better average and more power than the wrong catcher-named-McCann.
______________________________________________
Previously
Catching Fire: Boy, the starters need to carry that weight a longer time – 5/3
Catching Fire: Who’s Number Two? – 5/2
Related
Statements both obvious and only slightly less obvious about the Detroit Tigers’ finances
Shift the shift: Victor Martinez and counter-strategies
Feel like they never tell you the story of the Gose?
Getting to know Jordan Zimmermann in context
Highlights from MLB Network’s visit to Detroit Tigers spring training
2016 Detroit Tigers Season Preview: They’re Not Dead Yet

2015 and 2016 adjusted exit velocity leaderboards are available here: http://www.baseballprospectus.com/sortable/extras/statcast.php
Pingback: Catching Fire: Night of a thousand feet of home runs | ALDLAND